Mask R-CNN - Inspect Trained Model#
Code and visualizations to test, debug, and evaluate the Mask R-CNN model.
import os
import sys
import random
import math
import re
import time
import numpy as np
import tensorflow as tf
import matplotlib
import matplotlib.pyplot as plt
import matplotlib.patches as patches

# Root directory of the project
ROOT_DIR = os.path.abspath("../../")

# Import Mask RCNN
sys.path.append(ROOT_DIR)  # To find local version of the library
from mrcnn import utils
from mrcnn import visualize
from mrcnn.visualize import display_images
import mrcnn.model as modellib
from mrcnn.model import log

%matplotlib inline

# Directory to save logs and trained model
MODEL_DIR = os.path.join(ROOT_DIR, "logs")

# Local path to trained weights file
COCO_MODEL_PATH = os.path.join(ROOT_DIR, "mask_rcnn_coco.h5")
# Download COCO trained weights from Releases if needed
if not os.path.exists(COCO_MODEL_PATH):
    utils.download_trained_weights(COCO_MODEL_PATH)

# Path to Shapes trained weights
SHAPES_MODEL_PATH = os.path.join(ROOT_DIR, "mask_rcnn_shapes.h5")
Using TensorFlow backend.
Configurations#
# Run one of the code blocks

# Shapes toy dataset
# import shapes
# config = shapes.ShapesConfig()

# MS COCO Dataset
import coco
config = coco.CocoConfig()
COCO_DIR = "path to COCO dataset"  # TODO: enter value here
# Override the training configurations with a few
# changes for inferencing.
class InferenceConfig(config.__class__):
    # Run detection on one image at a time
    GPU_COUNT = 1
    IMAGES_PER_GPU = 1

config = InferenceConfig()
config.display()
Configurations:
BACKBONE_SHAPES                [[256 256]
 [128 128]
 [ 64  64]
 [ 32  32]
 [ 16  16]]
BACKBONE_STRIDES               [4, 8, 16, 32, 64]
BATCH_SIZE                     1
BBOX_STD_DEV                   [ 0.1  0.1  0.2  0.2]
DETECTION_MAX_INSTANCES        100
DETECTION_MIN_CONFIDENCE       0.5
DETECTION_NMS_THRESHOLD        0.3
GPU_COUNT                      1
IMAGES_PER_GPU                 1
IMAGE_MAX_DIM                  1024
IMAGE_MIN_DIM                  800
IMAGE_PADDING                  True
IMAGE_SHAPE                    [1024 1024    3]
LEARNING_MOMENTUM              0.9
LEARNING_RATE                  0.002
MASK_POOL_SIZE                 14
MASK_SHAPE                     [28, 28]
MAX_GT_INSTANCES               100
MEAN_PIXEL                     [ 123.7  116.8  103.9]
MINI_MASK_SHAPE                (56, 56)
NAME                           coco
NUM_CLASSES                    81
POOL_SIZE                      7
POST_NMS_ROIS_INFERENCE        1000
POST_NMS_ROIS_TRAINING         2000
ROI_POSITIVE_RATIO             0.33
RPN_ANCHOR_RATIOS              [0.5, 1, 2]
RPN_ANCHOR_SCALES              (32, 64, 128, 256, 512)
RPN_ANCHOR_STRIDE              2
RPN_BBOX_STD_DEV               [ 0.1  0.1  0.2  0.2]
RPN_TRAIN_ANCHORS_PER_IMAGE    256
STEPS_PER_EPOCH                1000
TRAIN_ROIS_PER_IMAGE           128
USE_MINI_MASK                  True
USE_RPN_ROIS                   True
VALIDATION_STEPS               50
WEIGHT_DECAY                   0.0001
Notebook Preferences#
# Device to load the neural network on.
# Useful if you're training a model on the same
# machine, in which case use CPU and leave the
# GPU for training.
DEVICE = "/cpu:0"  # /cpu:0 or /gpu:0

# Inspect the model in training or inference modes
# values: 'inference' or 'training'
# TODO: code for 'training' test mode not ready yet
TEST_MODE = "inference"
def get_ax(rows=1, cols=1, size=16):
    """Return a Matplotlib Axes array to be used in
    all visualizations in the notebook. Provide a
    central point to control graph sizes.

    Adjust the size attribute to control how big to render images
    """
    _, ax = plt.subplots(rows, cols, figsize=(size*cols, size*rows))
    return ax
Load Validation Dataset#
# Build validation dataset
if config.NAME == 'shapes':
    dataset = shapes.ShapesDataset()
    dataset.load_shapes(500, config.IMAGE_SHAPE[0], config.IMAGE_SHAPE[1])
elif config.NAME == "coco":
    dataset = coco.CocoDataset()
    dataset.load_coco(COCO_DIR, "minival")

# Must call before using the dataset
dataset.prepare()

print("Images: {}\nClasses: {}".format(len(dataset.image_ids), dataset.class_names))
loading annotations into memory...
Done (t=4.86s)
creating index...
index created!
Images: 35185
Classes: ['BG', 'person', 'bicycle', 'car', 'motorcycle', 'airplane', 'bus', 'train', 'truck', 'boat', 'traffic light', 'fire hydrant', 'stop sign', 'parking meter', 'bench', 'bird', 'cat', 'dog', 'horse', 'sheep', 'cow', 'elephant', 'bear', 'zebra', 'giraffe', 'backpack', 'umbrella', 'handbag', 'tie', 'suitcase', 'frisbee', 'skis', 'snowboard', 'sports ball', 'kite', 'baseball bat', 'baseball glove', 'skateboard', 'surfboard', 'tennis racket', 'bottle', 'wine glass', 'cup', 'fork', 'knife', 'spoon', 'bowl', 'banana', 'apple', 'sandwich', 'orange', 'broccoli', 'carrot', 'hot dog', 'pizza', 'donut', 'cake', 'chair', 'couch', 'potted plant', 'bed', 'dining table', 'toilet', 'tv', 'laptop', 'mouse', 'remote', 'keyboard', 'cell phone', 'microwave', 'oven', 'toaster', 'sink', 'refrigerator', 'book', 'clock', 'vase', 'scissors', 'teddy bear', 'hair drier', 'toothbrush']
Load Model#
# Create model in inference mode
with tf.device(DEVICE):
    model = modellib.MaskRCNN(mode="inference", model_dir=MODEL_DIR,
                              config=config)

# Set weights file path
if config.NAME == "shapes":
    weights_path = SHAPES_MODEL_PATH
elif config.NAME == "coco":
    weights_path = COCO_MODEL_PATH
# Or, uncomment to load the last model you trained
# weights_path = model.find_last()

# Load weights
print("Loading weights ", weights_path)
model.load_weights(weights_path, by_name=True)
Run Detection#
image_id = random.choice(dataset.image_ids)
image, image_meta, gt_class_id, gt_bbox, gt_mask =\
modellib.load_image_gt(dataset, config, image_id, use_mini_mask=False)
info = dataset.image_info[image_id]
print("image ID: {}.{} ({}) {}".format(info["source"], info["id"], image_id,
dataset.image_reference(image_id)))
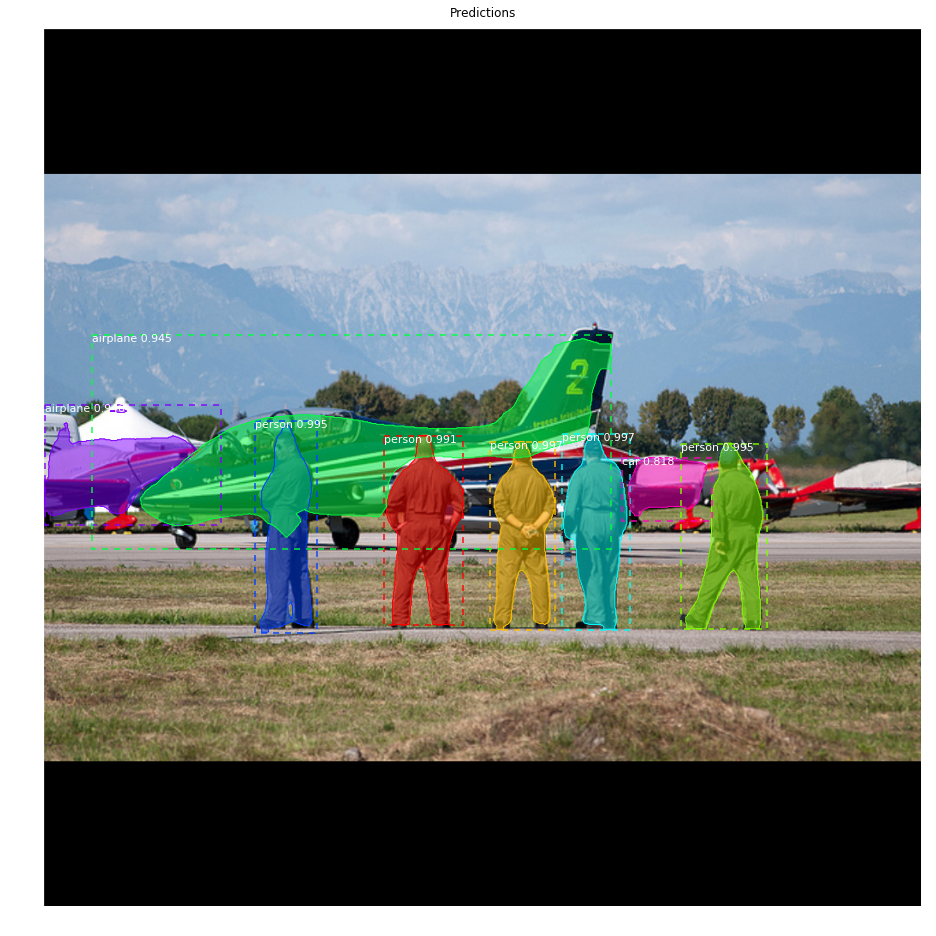
# Run object detection
results = model.detect([image], verbose=1)
# Display results
ax = get_ax(1)
r = results[0]
visualize.display_instances(image, r['rois'], r['masks'], r['class_ids'],
dataset.class_names, r['scores'], ax=ax,
title="Predictions")
log("gt_class_id", gt_class_id)
log("gt_bbox", gt_bbox)
log("gt_mask", gt_mask)
image ID: coco.392144 (34940) http://cocodataset.org/#explore?id=392144
Processing 1 images
image                    shape: (1024, 1024, 3)       min:    0.00000  max:  255.00000
molded_images            shape: (1, 1024, 1024, 3)    min: -123.70000  max:  151.10000
image_metas              shape: (1, 89)               min:    0.00000  max: 1024.00000
gt_class_id              shape: (10,)                 min:    1.00000  max:   40.00000
gt_bbox                  shape: (10, 5)               min:    0.00000  max: 1024.00000
gt_mask                  shape: (1024, 1024, 10)      min:    0.00000  max:    1.00000
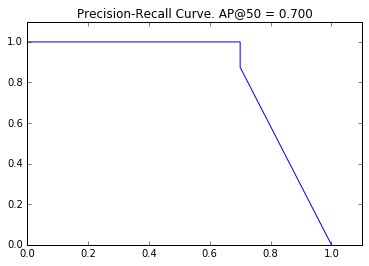
Precision-Recall#
# Draw precision-recall curve
AP, precisions, recalls, overlaps = utils.compute_ap(gt_bbox, gt_class_id, gt_mask,
                                          r['rois'], r['class_ids'], r['scores'], r['masks'])
visualize.plot_precision_recall(AP, precisions, recalls)
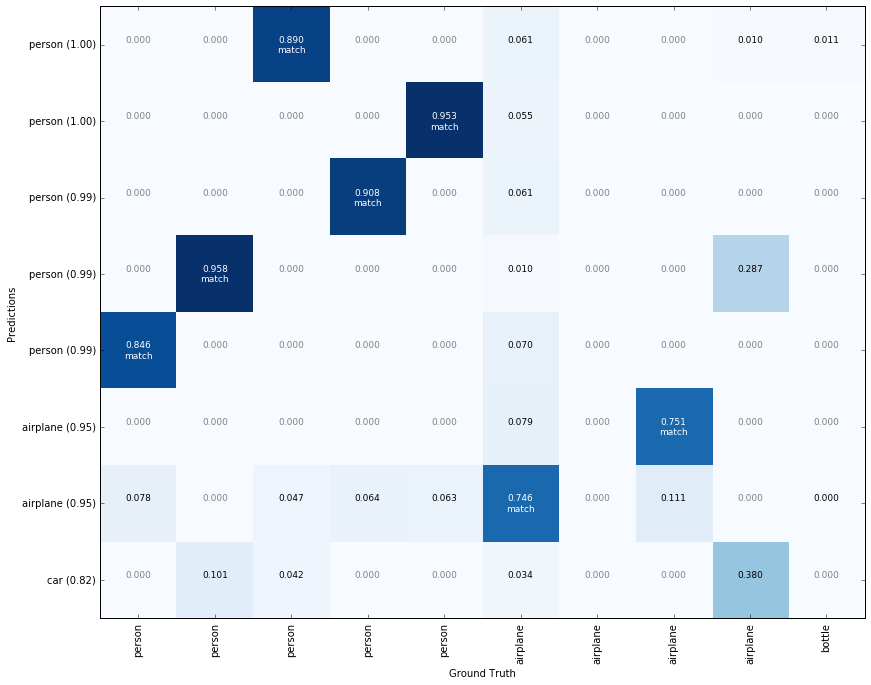
# Grid of ground truth objects and their predictions
visualize.plot_overlaps(gt_class_id, r['class_ids'], r['scores'],
                        overlaps, dataset.class_names)
Compute mAP @ IoU=50 on Batch of Images#
# Compute VOC-style Average Precision
def compute_batch_ap(image_ids):
    APs = []
    for image_id in image_ids:
        # Load image
        image, image_meta, gt_class_id, gt_bbox, gt_mask =\
            modellib.load_image_gt(dataset, config,
                                   image_id, use_mini_mask=False)
        # Run object detection
        results = model.detect([image], verbose=0)
        # Compute AP
        r = results[0]
        AP, precisions, recalls, overlaps =\
            utils.compute_ap(gt_bbox, gt_class_id, gt_mask,
                              r['rois'], r['class_ids'], r['scores'], r['masks'])
        APs.append(AP)
    return APs

# Pick a set of random images
image_ids = np.random.choice(dataset.image_ids, 10)
APs = compute_batch_ap(image_ids)
print("mAP @ IoU=50: ", np.mean(APs))
mAP @ IoU=50: 0.656323084916
/usr/local/lib/python3.5/dist-packages/scipy/ndimage/interpolation.py:600: UserWarning: From scipy 0.13.0, the output shape of zoom() is calculated with round() instead of int() - for these inputs the size of the returned array has changed.
  "the returned array has changed.", UserWarning)
Step by Step Prediction#
Stage 1: Region Proposal Network#
The Region Proposal Network (RPN) runs a lightweight binary classifier on a lot of boxes (anchors) over the image and returns object/no-object scores. Anchors with high objectness score (positive anchors) are passed to the stage two to be classified.
Often, even positive anchors don’t cover objects fully. So the RPN also regresses a refinement (a delta in location and size) to be applied to the anchors to shift it and resize it a bit to the correct boundaries of the object.
1.a RPN Targets#
The RPN targets are the training values for the RPN. To generate the targets, we start with a grid of anchors that cover the full image at different scales, and then we compute the IoU of the anchors with ground truth object. Positive anchors are those that have an IoU >= 0.7 with any ground truth object, and negative anchors are those that don’t cover any object by more than 0.3 IoU. Anchors in between (i.e. cover an object by IoU >= 0.3 but < 0.7) are considered neutral and excluded from training.
To train the RPN regressor, we also compute the shift and resizing needed to make the anchor cover the ground truth object completely.
# Generate RPN trainig targets
# target_rpn_match is 1 for positive anchors, -1 for negative anchors
# and 0 for neutral anchors.
target_rpn_match, target_rpn_bbox = modellib.build_rpn_targets(
    image.shape, model.anchors, gt_class_id, gt_bbox, model.config)
log("target_rpn_match", target_rpn_match)
log("target_rpn_bbox", target_rpn_bbox)

positive_anchor_ix = np.where(target_rpn_match[:] == 1)[0]
negative_anchor_ix = np.where(target_rpn_match[:] == -1)[0]
neutral_anchor_ix = np.where(target_rpn_match[:] == 0)[0]
positive_anchors = model.anchors[positive_anchor_ix]
negative_anchors = model.anchors[negative_anchor_ix]
neutral_anchors = model.anchors[neutral_anchor_ix]
log("positive_anchors", positive_anchors)
log("negative_anchors", negative_anchors)
log("neutral anchors", neutral_anchors)

# Apply refinement deltas to positive anchors
refined_anchors = utils.apply_box_deltas(
    positive_anchors,
    target_rpn_bbox[:positive_anchors.shape[0]] * model.config.RPN_BBOX_STD_DEV)
log("refined_anchors", refined_anchors, )
target_rpn_match         shape: (65472,)              min:   -1.00000  max:    1.00000
target_rpn_bbox          shape: (256, 4)              min:   -5.19860  max:    2.59641
positive_anchors         shape: (14, 4)               min:    5.49033  max:  973.25483
negative_anchors         shape: (242, 4)              min:  -22.62742  max: 1038.62742
neutral anchors          shape: (65216, 4)            min: -362.03867  max: 1258.03867
refined_anchors          shape: (14, 4)               min:    0.00000  max: 1023.99994
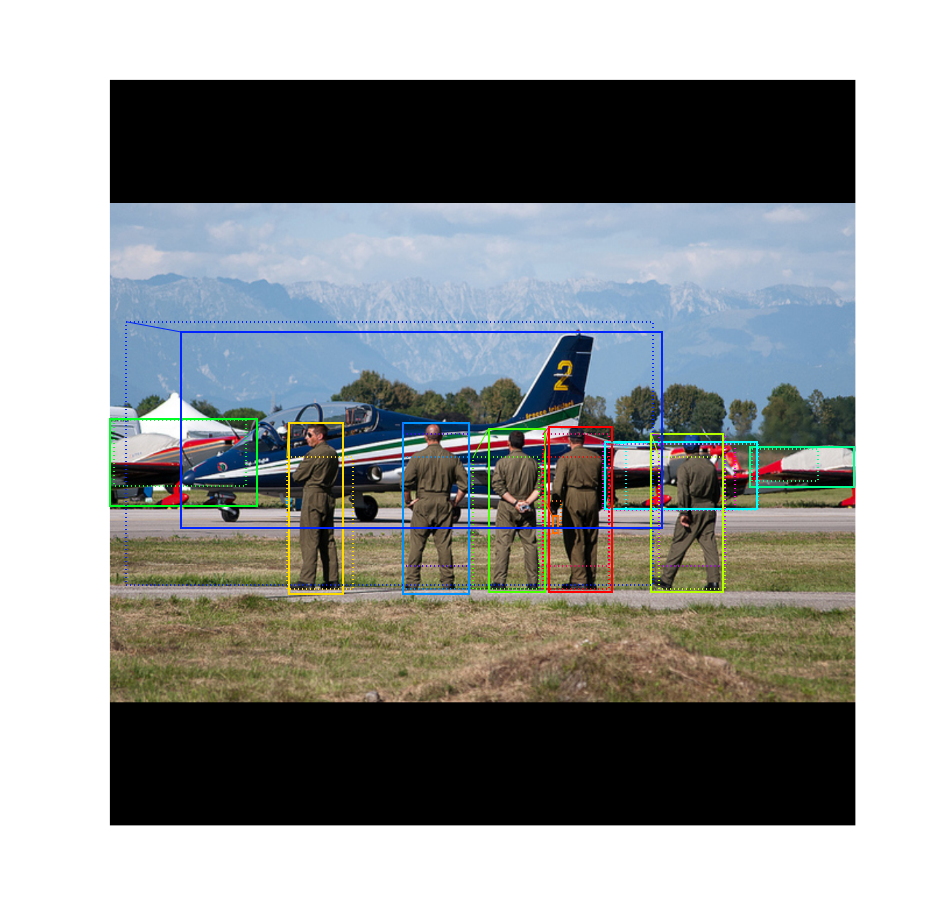
# Display positive anchors before refinement (dotted) and
# after refinement (solid).
visualize.draw_boxes(image, boxes=positive_anchors, refined_boxes=refined_anchors, ax=get_ax())
1.b RPN Predictions#
Here we run the RPN graph and display its predictions.
# Run RPN sub-graph
pillar = model.keras_model.get_layer("ROI").output  # node to start searching from

# TF 1.4 and 1.9 introduce new versions of NMS. Search for all names to support TF 1.3~1.10
nms_node = model.ancestor(pillar, "ROI/rpn_non_max_suppression:0")
if nms_node is None:
    nms_node = model.ancestor(pillar, "ROI/rpn_non_max_suppression/NonMaxSuppressionV2:0")
if nms_node is None: #TF 1.9-1.10
    nms_node = model.ancestor(pillar, "ROI/rpn_non_max_suppression/NonMaxSuppressionV3:0")

rpn = model.run_graph([image], [
    ("rpn_class", model.keras_model.get_layer("rpn_class").output),
    ("pre_nms_anchors", model.ancestor(pillar, "ROI/pre_nms_anchors:0")),
    ("refined_anchors", model.ancestor(pillar, "ROI/refined_anchors:0")),
    ("refined_anchors_clipped", model.ancestor(pillar, "ROI/refined_anchors_clipped:0")),
    ("post_nms_anchor_ix", nms_node),
    ("proposals", model.keras_model.get_layer("ROI").output),
])
rpn_class                shape: (1, 65472, 2)         min:    0.00000  max:    1.00000
pre_nms_anchors          shape: (1, 10000, 4)         min: -362.03867  max: 1258.03870
refined_anchors          shape: (1, 10000, 4)         min: -1385.67920  max: 2212.44043
refined_anchors_clipped  shape: (1, 10000, 4)         min:    0.00000  max: 1024.00000
post_nms_anchor_ix       shape: (1000,)               min:    0.00000  max: 1477.00000
proposals                shape: (1, 1000, 4)          min:    0.00000  max:    1.00000
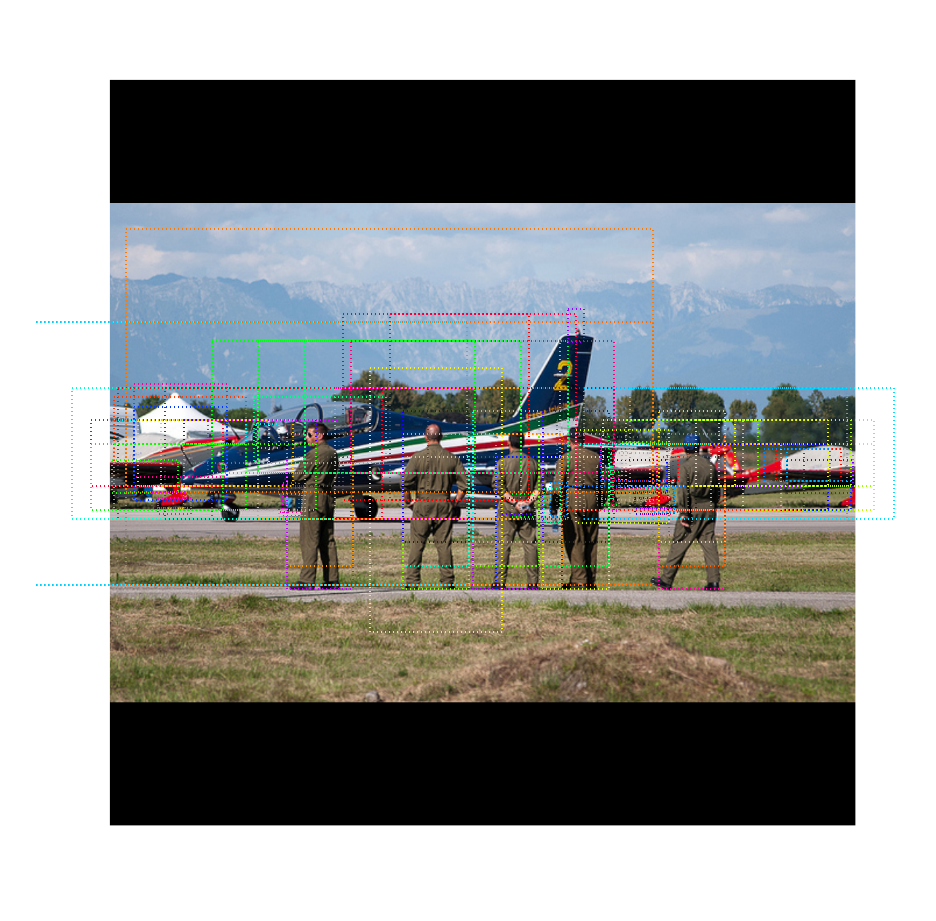
# Show top anchors by score (before refinement)
limit = 100
sorted_anchor_ids = np.argsort(rpn['rpn_class'][:,:,1].flatten())[::-1]
visualize.draw_boxes(image, boxes=model.anchors[sorted_anchor_ids[:limit]], ax=get_ax())
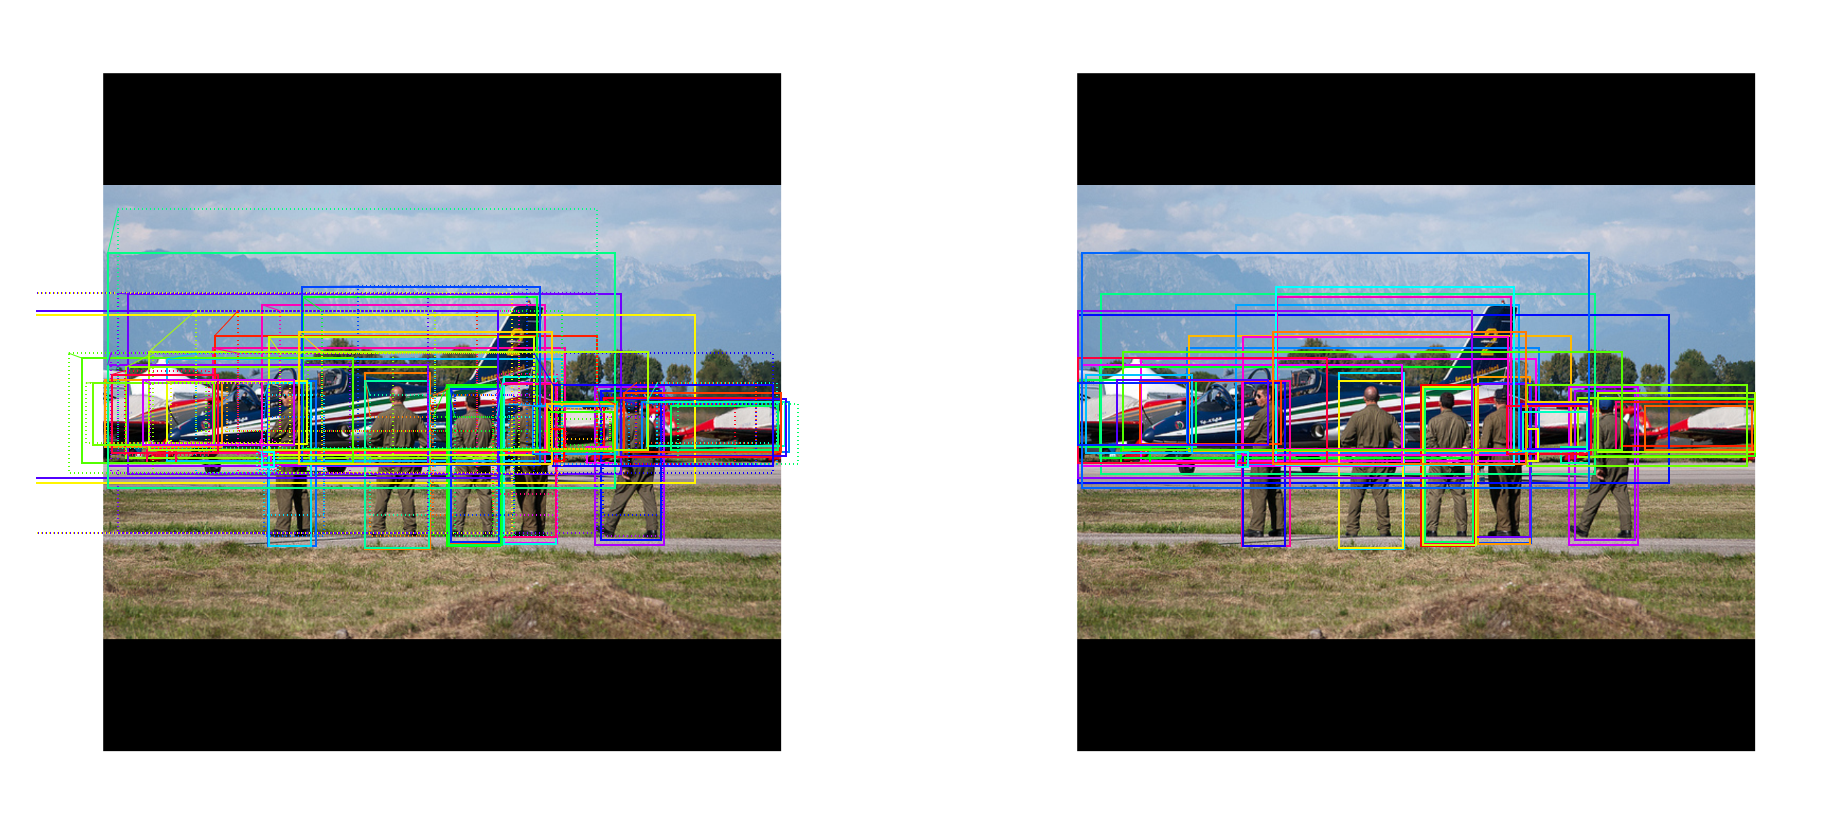
# Show top anchors with refinement. Then with clipping to image boundaries
limit = 50
ax = get_ax(1, 2)
pre_nms_anchors = utils.denorm_boxes(rpn["pre_nms_anchors"][0], image.shape[:2])
refined_anchors = utils.denorm_boxes(rpn["refined_anchors"][0], image.shape[:2])
refined_anchors_clipped = utils.denorm_boxes(rpn["refined_anchors_clipped"][0], image.shape[:2])
visualize.draw_boxes(image, boxes=pre_nms_anchors[:limit],
                     refined_boxes=refined_anchors[:limit], ax=ax[0])
visualize.draw_boxes(image, refined_boxes=refined_anchors_clipped[:limit], ax=ax[1])
# Show refined anchors after non-max suppression
limit = 50
ixs = rpn["post_nms_anchor_ix"][:limit]
visualize.draw_boxes(image, refined_boxes=refined_anchors_clipped[ixs], ax=get_ax())
# Show final proposals
# These are the same as the previous step (refined anchors
# after NMS) but with coordinates normalized to [0, 1] range.
limit = 50
# Convert back to image coordinates for display
h, w = config.IMAGE_SHAPE[:2]
proposals = rpn['proposals'][0, :limit] * np.array([h, w, h, w])
visualize.draw_boxes(image, refined_boxes=proposals, ax=get_ax())
# Measure the RPN recall (percent of objects covered by anchors)
# Here we measure recall for 3 different methods:
# - All anchors
# - All refined anchors
# - Refined anchors after NMS
iou_threshold = 0.7

recall, positive_anchor_ids = utils.compute_recall(model.anchors, gt_bbox, iou_threshold)
print("All Anchors ({:5})       Recall: {:.3f}  Positive anchors: {}".format(
    model.anchors.shape[0], recall, len(positive_anchor_ids)))

recall, positive_anchor_ids = utils.compute_recall(rpn['refined_anchors'][0], gt_bbox, iou_threshold)
print("Refined Anchors ({:5})   Recall: {:.3f}  Positive anchors: {}".format(
    rpn['refined_anchors'].shape[1], recall, len(positive_anchor_ids)))

recall, positive_anchor_ids = utils.compute_recall(proposals, gt_bbox, iou_threshold)
print("Post NMS Anchors ({:5})  Recall: {:.3f}  Positive anchors: {}".format(
    proposals.shape[0], recall, len(positive_anchor_ids)))
All Anchors (65472)       Recall: 0.400  Positive anchors: 8
Refined Anchors (10000)   Recall: 0.900  Positive anchors: 65
Post NMS Anchors (   50)  Recall: 0.800  Positive anchors: 9
Stage 2: Proposal Classification#
This stage takes the region proposals from the RPN and classifies them.
2.a Proposal Classification#
Run the classifier heads on proposals to generate class propbabilities and bounding box regressions.
# Get input and output to classifier and mask heads.
mrcnn = model.run_graph([image], [
    ("proposals", model.keras_model.get_layer("ROI").output),
    ("probs", model.keras_model.get_layer("mrcnn_class").output),
    ("deltas", model.keras_model.get_layer("mrcnn_bbox").output),
    ("masks", model.keras_model.get_layer("mrcnn_mask").output),
    ("detections", model.keras_model.get_layer("mrcnn_detection").output),
])
proposals                shape: (1, 1000, 4)          min:    0.00000  max:    1.00000
probs                    shape: (1, 1000, 81)         min:    0.00000  max:    0.99999
deltas                   shape: (1, 1000, 81, 4)      min:   -3.26400  max:    3.83929
masks                    shape: (1, 100, 28, 28, 81)  min:    0.00000  max:    0.99984
detections               shape: (1, 100, 6)           min:    0.00000  max:  844.00000
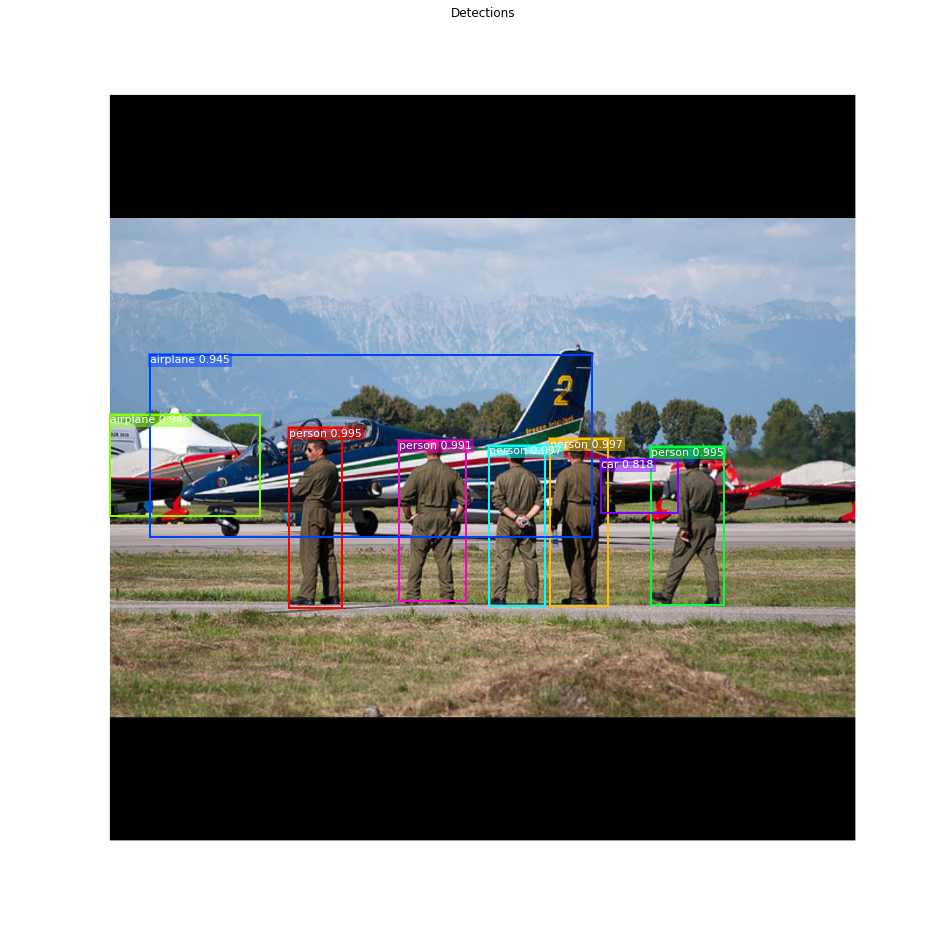
# Get detection class IDs. Trim zero padding.
det_class_ids = mrcnn['detections'][0, :, 4].astype(np.int32)
det_count = np.where(det_class_ids == 0)[0][0]
det_class_ids = det_class_ids[:det_count]
detections = mrcnn['detections'][0, :det_count]

print("{} detections: {}".format(
    det_count, np.array(dataset.class_names)[det_class_ids]))

captions = ["{} {:.3f}".format(dataset.class_names[int(c)], s) if c > 0 else ""
            for c, s in zip(detections[:, 4], detections[:, 5])]
visualize.draw_boxes(
    image,
    refined_boxes=utils.denorm_boxes(detections[:, :4], image.shape[:2]),
    visibilities=[2] * len(detections),
    captions=captions, title="Detections",
    ax=get_ax())
8 detections: ['person' 'person' 'person' 'person' 'person' 'airplane' 'airplane' 'car']
2.c Step by Step Detection#
Here we dive deeper into the process of processing the detections.
# Proposals are in normalized coordinates. Scale them
# to image coordinates.
h, w = config.IMAGE_SHAPE[:2]
proposals = np.around(mrcnn["proposals"][0] * np.array([h, w, h, w])).astype(np.int32)

# Class ID, score, and mask per proposal
roi_class_ids = np.argmax(mrcnn["probs"][0], axis=1)
roi_scores = mrcnn["probs"][0, np.arange(roi_class_ids.shape[0]), roi_class_ids]
roi_class_names = np.array(dataset.class_names)[roi_class_ids]
roi_positive_ixs = np.where(roi_class_ids > 0)[0]

# How many ROIs vs empty rows?
print("{} Valid proposals out of {}".format(np.sum(np.any(proposals, axis=1)), proposals.shape[0]))
print("{} Positive ROIs".format(len(roi_positive_ixs)))

# Class counts
print(list(zip(*np.unique(roi_class_names, return_counts=True))))
1000 Valid proposals out of 1000
71 Positive ROIs
[('BG', 929), ('airplane', 23), ('car', 11), ('person', 37)]
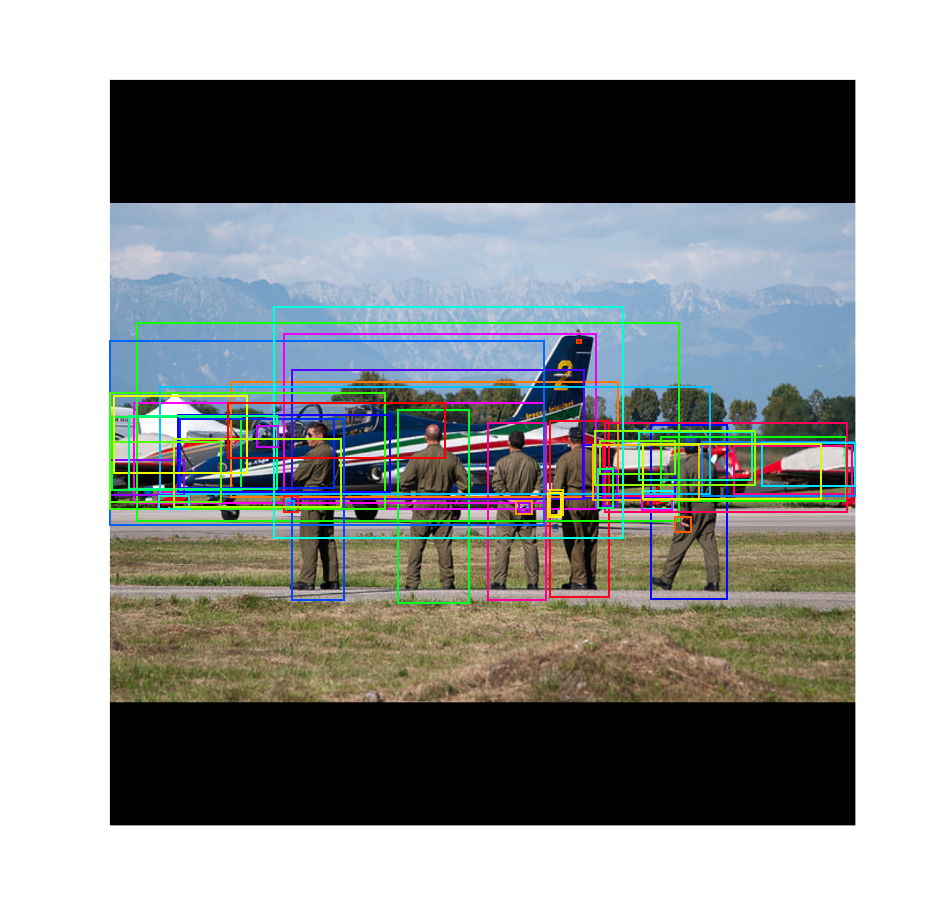
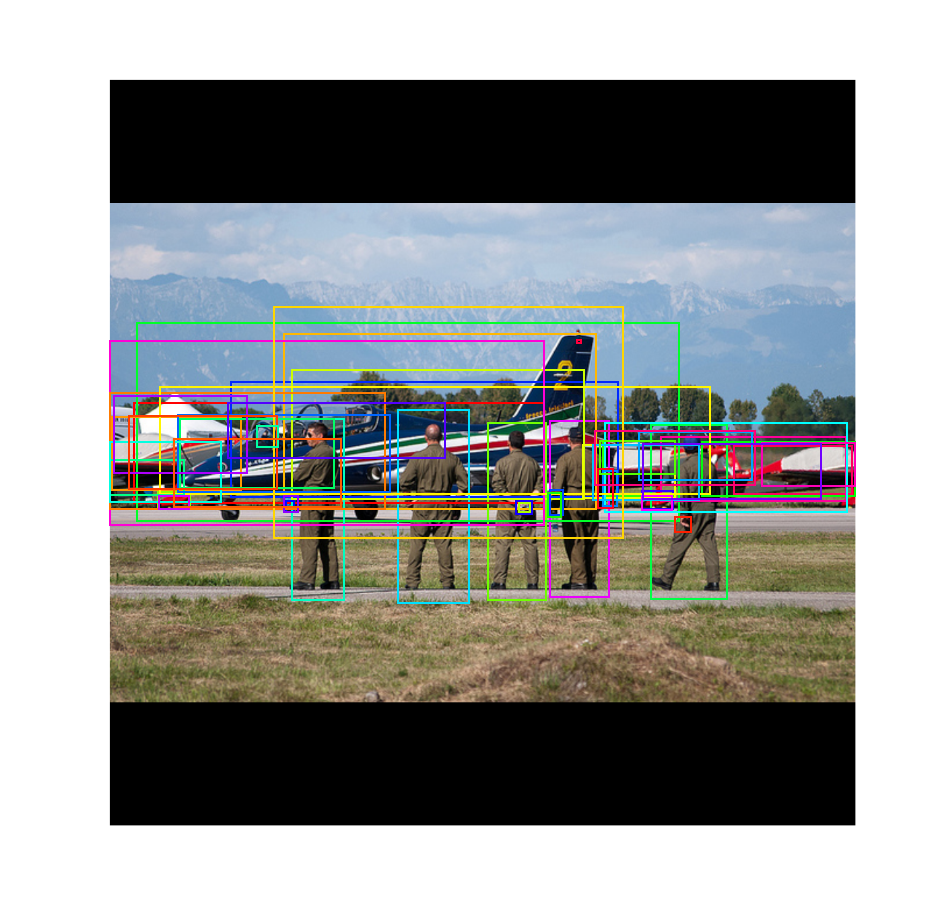
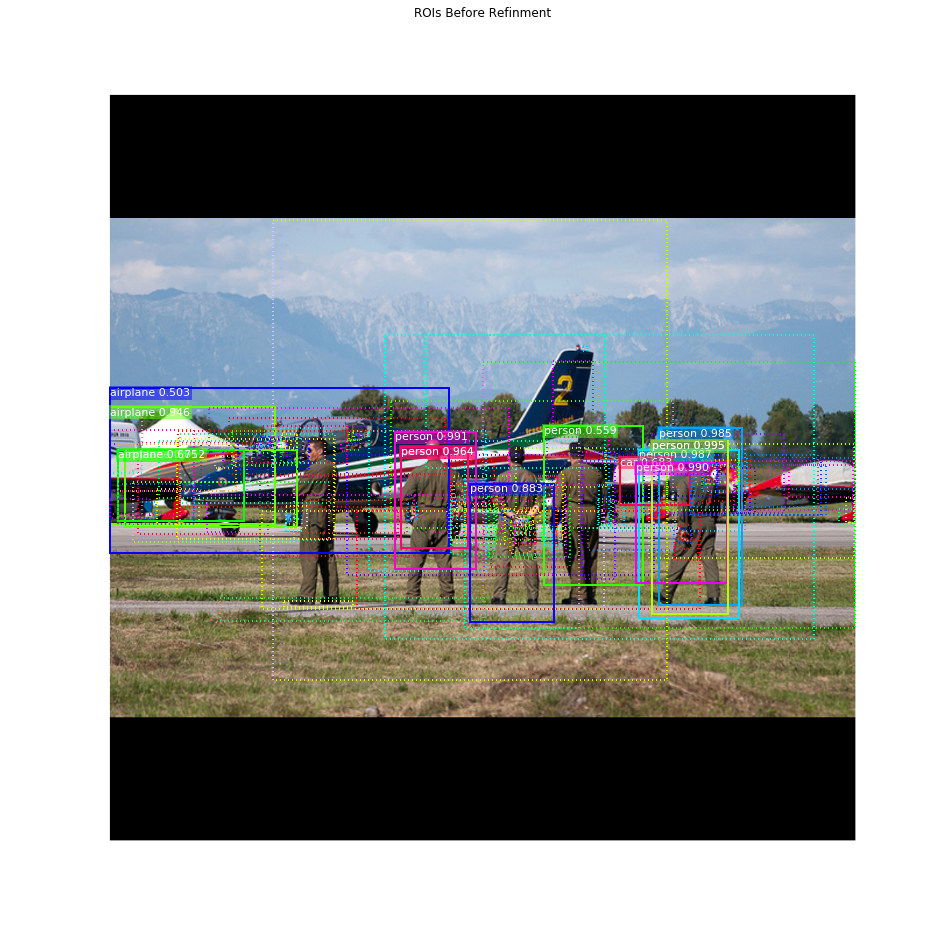
# Display a random sample of proposals.
# Proposals classified as background are dotted, and
# the rest show their class and confidence score.
limit = 200
ixs = np.random.randint(0, proposals.shape[0], limit)
captions = ["{} {:.3f}".format(dataset.class_names[c], s) if c > 0 else ""
            for c, s in zip(roi_class_ids[ixs], roi_scores[ixs])]
visualize.draw_boxes(image, boxes=proposals[ixs],
                     visibilities=np.where(roi_class_ids[ixs] > 0, 2, 1),
                     captions=captions, title="ROIs Before Refinement",
                     ax=get_ax())
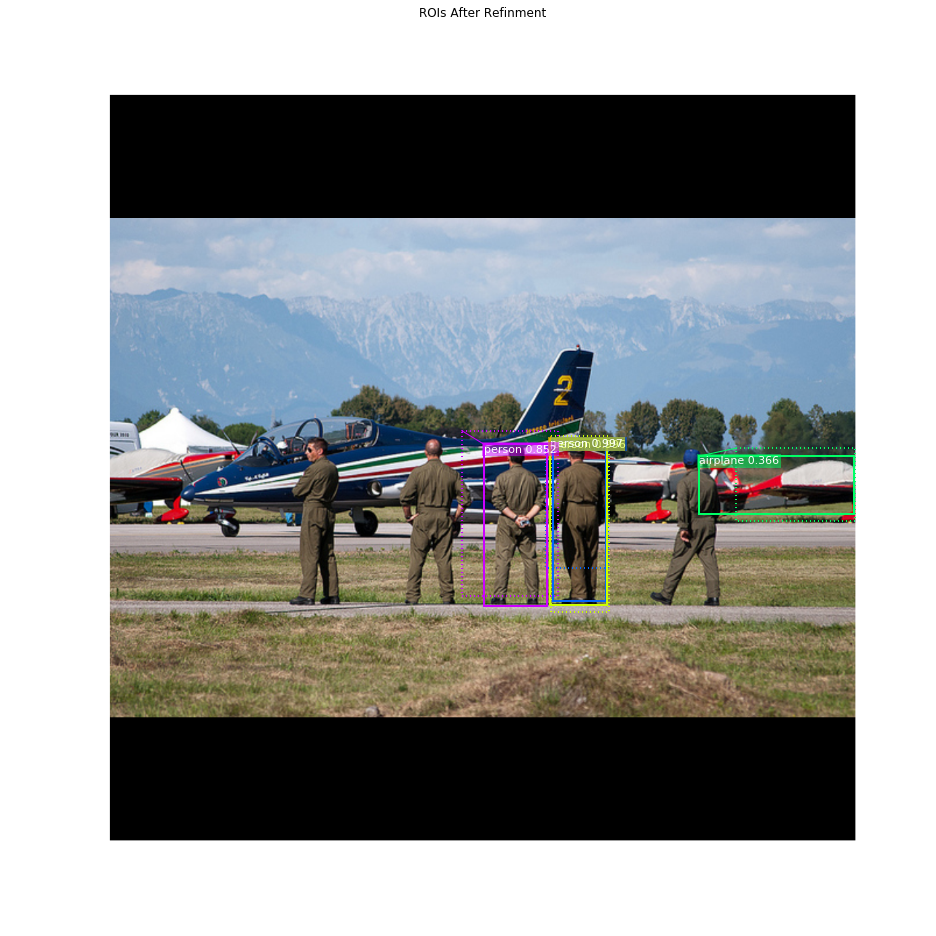
Apply Bounding Box Refinement#
# Class-specific bounding box shifts.
roi_bbox_specific = mrcnn["deltas"][0, np.arange(proposals.shape[0]), roi_class_ids]
log("roi_bbox_specific", roi_bbox_specific)

# Apply bounding box transformations
# Shape: [N, (y1, x1, y2, x2)]
refined_proposals = utils.apply_box_deltas(
    proposals, roi_bbox_specific * config.BBOX_STD_DEV).astype(np.int32)
log("refined_proposals", refined_proposals)

# Show positive proposals
# ids = np.arange(roi_boxes.shape[0])  # Display all
limit = 5
ids = np.random.randint(0, len(roi_positive_ixs), limit)  # Display random sample
captions = ["{} {:.3f}".format(dataset.class_names[c], s) if c > 0 else ""
            for c, s in zip(roi_class_ids[roi_positive_ixs][ids], roi_scores[roi_positive_ixs][ids])]
visualize.draw_boxes(image, boxes=proposals[roi_positive_ixs][ids],
                     refined_boxes=refined_proposals[roi_positive_ixs][ids],
                     visibilities=np.where(roi_class_ids[roi_positive_ixs][ids] > 0, 1, 0),
                     captions=captions, title="ROIs After Refinement",
                     ax=get_ax())
roi_bbox_specific        shape: (1000, 4)             min:   -2.44748  max:    2.94838
refined_proposals        shape: (1000, 4)             min:   -8.00000  max: 1028.00000
Filter Low Confidence Detections#
# Remove boxes classified as background
keep = np.where(roi_class_ids > 0)[0]
print("Keep {} detections:\n{}".format(keep.shape[0], keep))
Keep 71 detections:
[  0   2   3   4   5   6   8   9  16  17  18  19  25  30  36  37  38  40
  42  50  51  67  68  74  78  79  92 158 162 177 187 191 209 225 261 284
 292 314 328 374 402 403 409 429 473 490 499 516 545 557 572 575 607 624
 638 639 671 703 719 744 753 754 778 790 813 815 848 862 865 876 911]
# Remove low confidence detections
keep = np.intersect1d(keep, np.where(roi_scores >= config.DETECTION_MIN_CONFIDENCE)[0])
print("Remove boxes below {} confidence. Keep {}:\n{}".format(
    config.DETECTION_MIN_CONFIDENCE, keep.shape[0], keep))
Remove boxes below 0.5 confidence. Keep 67:
[  0   2   4   5   6   8   9  16  17  18  19  25  30  36  37  38  40  42
  50  51  67  68  74  78  79 158 162 177 187 191 209 225 284 292 314 328
 374 402 403 409 429 473 490 499 516 545 557 575 607 624 638 639 671 703
 719 744 753 754 778 790 813 815 848 862 865 876 911]
Per-Class Non-Max Suppression#
# Apply per-class non-max suppression
pre_nms_boxes = refined_proposals[keep]
pre_nms_scores = roi_scores[keep]
pre_nms_class_ids = roi_class_ids[keep]

nms_keep = []
for class_id in np.unique(pre_nms_class_ids):
    # Pick detections of this class
    ixs = np.where(pre_nms_class_ids == class_id)[0]
    # Apply NMS
    class_keep = utils.non_max_suppression(pre_nms_boxes[ixs],
                                            pre_nms_scores[ixs],
                                            config.DETECTION_NMS_THRESHOLD)
    # Map indicies
    class_keep = keep[ixs[class_keep]]
    nms_keep = np.union1d(nms_keep, class_keep)
    print("{:22}: {} -> {}".format(dataset.class_names[class_id][:20],
                                   keep[ixs], class_keep))

keep = np.intersect1d(keep, nms_keep).astype(np.int32)
print("\nKept after per-class NMS: {}\n{}".format(keep.shape[0], keep))
person                : [  0   2   5   6   9  67  68  74  79 158 162 187 191 225 284 374 403 409
 429 490 545 557 575 607 638 671 703 744 753 754 778 790 813 848 862 876
 911] -> [  0 162   9   2 671]
car                   : [ 16  18  30  36  51 177 314 328 499 624 815] -> [30]
airplane              : [  4   8  17  19  25  37  38  40  42  50  78 209 292 402 473 516 639 719
 865] -> [78 19]

Kept after per-class NMS: 8
[  0   2   9  19  30  78 162 671]
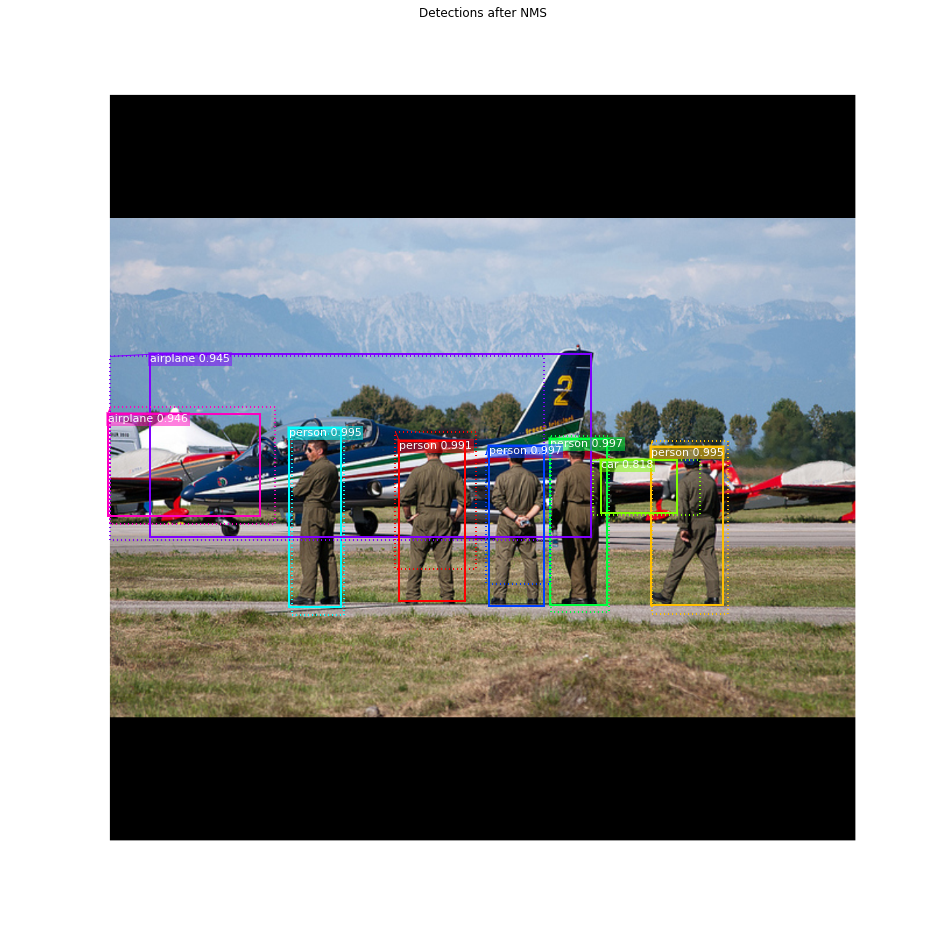
# Show final detections
ixs = np.arange(len(keep))  # Display all
# ixs = np.random.randint(0, len(keep), 10)  # Display random sample
captions = ["{} {:.3f}".format(dataset.class_names[c], s) if c > 0 else ""
            for c, s in zip(roi_class_ids[keep][ixs], roi_scores[keep][ixs])]
visualize.draw_boxes(
    image, boxes=proposals[keep][ixs],
    refined_boxes=refined_proposals[keep][ixs],
    visibilities=np.where(roi_class_ids[keep][ixs] > 0, 1, 0),
    captions=captions, title="Detections after NMS",
    ax=get_ax())
Stage 3: Generating Masks#
This stage takes the detections (refined bounding boxes and class IDs) from the previous layer and runs the mask head to generate segmentation masks for every instance.
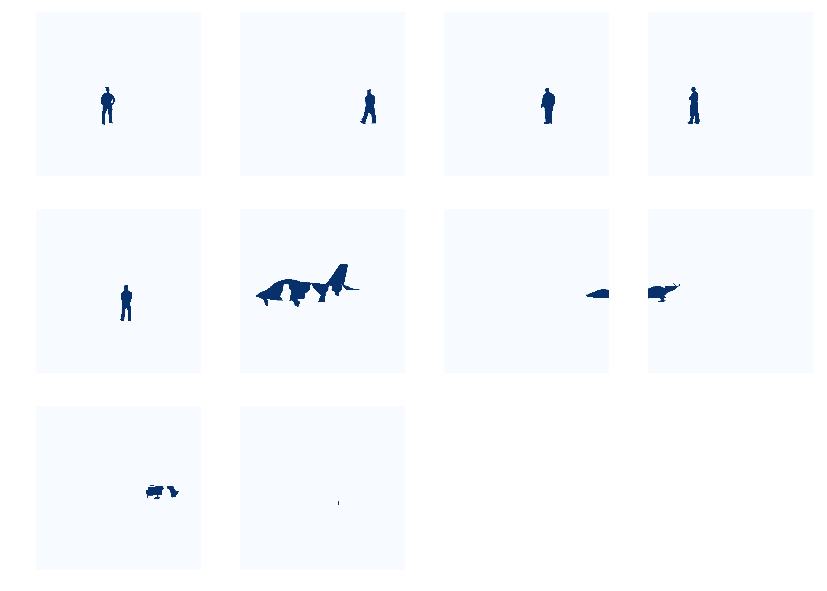
3.a Mask Targets#
These are the training targets for the mask branch
display_images(np.transpose(gt_mask, [2, 0, 1]), cmap="Blues")
3.b Predicted Masks#
# Get predictions of mask head
mrcnn = model.run_graph([image], [
    ("detections", model.keras_model.get_layer("mrcnn_detection").output),
    ("masks", model.keras_model.get_layer("mrcnn_mask").output),
])

# Get detection class IDs. Trim zero padding.
det_class_ids = mrcnn['detections'][0, :, 4].astype(np.int32)
det_count = np.where(det_class_ids == 0)[0][0]
det_class_ids = det_class_ids[:det_count]

print("{} detections: {}".format(
    det_count, np.array(dataset.class_names)[det_class_ids]))
detections               shape: (1, 100, 6)           min:    0.00000  max:  844.00000
masks                    shape: (1, 100, 28, 28, 81)  min:    0.00000  max:    0.99984
8 detections: ['person' 'person' 'person' 'person' 'person' 'airplane' 'airplane' 'car']
# Masks
det_boxes = utils.denorm_boxes(mrcnn["detections"][0, :, :4], image.shape[:2])
det_mask_specific = np.array([mrcnn["masks"][0, i, :, :, c]
                              for i, c in enumerate(det_class_ids)])
det_masks = np.array([utils.unmold_mask(m, det_boxes[i], image.shape)
                      for i, m in enumerate(det_mask_specific)])
log("det_mask_specific", det_mask_specific)
log("det_masks", det_masks)
det_mask_specific        shape: (8, 28, 28)           min:    0.00001  max:    0.99984
det_masks                shape: (8, 1024, 1024)       min:    0.00000  max:    1.00000
display_images(det_mask_specific[:4] * 255, cmap="Blues", interpolation="none")
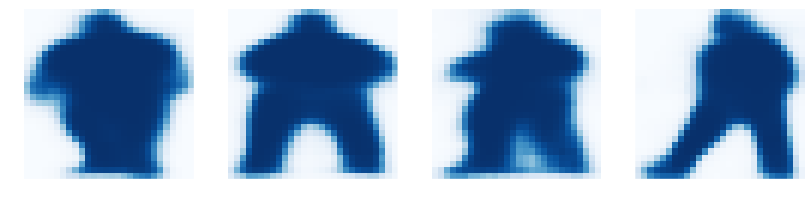
display_images(det_masks[:4] * 255, cmap="Blues", interpolation="none")

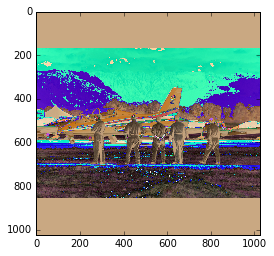
Visualize Activations#
In some cases it helps to look at the output from different layers and visualize them to catch issues and odd patterns.
# Get activations of a few sample layers
activations = model.run_graph([image], [
    ("input_image",        tf.identity(model.keras_model.get_layer("input_image").output)),
    ("res4w_out",          model.keras_model.get_layer("res4w_out").output),  # for resnet100
    ("rpn_bbox",           model.keras_model.get_layer("rpn_bbox").output),
    ("roi",                model.keras_model.get_layer("ROI").output),
])
input_image              shape: (1, 1024, 1024, 3)    min: -123.70000  max:  151.10001
res4w_out                shape: (1, 64, 64, 1024)     min:    0.00000  max:   54.64681
rpn_bbox                 shape: (1, 65472, 4)         min:  -12.26412  max:   18.18265
roi                      shape: (1, 1000, 4)          min:    0.00000  max:    1.00000
# Input image (normalized)
_ = plt.imshow(modellib.unmold_image(activations["input_image"][0],config))
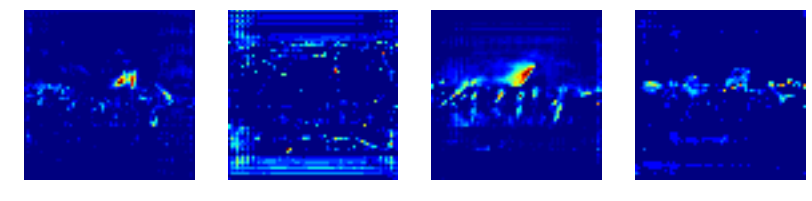
# Backbone feature map
display_images(np.transpose(activations["res4w_out"][0,:,:,:4], [2, 0, 1]))
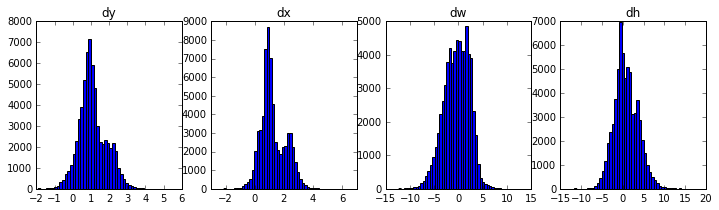
# Histograms of RPN bounding box deltas
plt.figure(figsize=(12, 3))
plt.subplot(1, 4, 1)
plt.title("dy")
_ = plt.hist(activations["rpn_bbox"][0,:,0], 50)
plt.subplot(1, 4, 2)
plt.title("dx")
_ = plt.hist(activations["rpn_bbox"][0,:,1], 50)
plt.subplot(1, 4, 3)
plt.title("dw")
_ = plt.hist(activations["rpn_bbox"][0,:,2], 50)
plt.subplot(1, 4, 4)
plt.title("dh")
_ = plt.hist(activations["rpn_bbox"][0,:,3], 50)
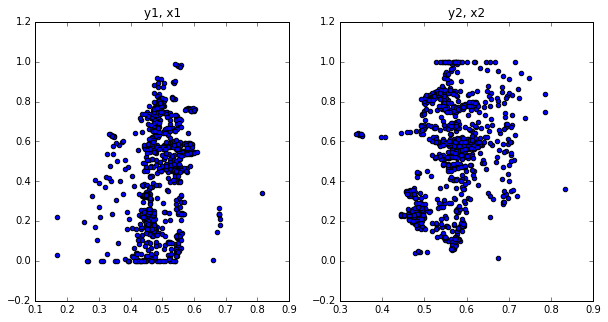
# Distribution of y, x coordinates of generated proposals
plt.figure(figsize=(10, 5))
plt.subplot(1, 2, 1)
plt.title("y1, x1")
plt.scatter(activations["roi"][0,:,0], activations["roi"][0,:,1])
plt.subplot(1, 2, 2)
plt.title("y2, x2")
plt.scatter(activations["roi"][0,:,2], activations["roi"][0,:,3])
plt.show()