Mask R-CNN - Inspect Training Data#
Inspect and visualize data loading and pre-processing code.
import os
import sys
import itertools
import math
import logging
import json
import re
import random
from collections import OrderedDict
import numpy as np
import matplotlib
import matplotlib.pyplot as plt
import matplotlib.patches as patches
import matplotlib.lines as lines
from matplotlib.patches import Polygon

# Root directory of the project
ROOT_DIR = os.path.abspath("../../")

# Import Mask RCNN
sys.path.append(ROOT_DIR)  # To find local version of the library
from mrcnn import utils
from mrcnn import visualize
from mrcnn.visualize import display_images
import mrcnn.model as modellib
from mrcnn.model import log

%matplotlib inline
Using TensorFlow backend.
Configurations#
Run one of the code blocks below to import and load the configurations to use.
# Run one of the code blocks

# Shapes toy dataset
# import shapes
# config = shapes.ShapesConfig()

# MS COCO Dataset
import coco
config = coco.CocoConfig()
COCO_DIR = "path to COCO dataset"  # TODO: enter value here
Dataset#
# Load dataset
if config.NAME == 'shapes':
    dataset = shapes.ShapesDataset()
    dataset.load_shapes(500, config.IMAGE_SHAPE[0], config.IMAGE_SHAPE[1])
elif config.NAME == "coco":
    dataset = coco.CocoDataset()
    dataset.load_coco(COCO_DIR, "train")

# Must call before using the dataset
dataset.prepare()

print("Image Count: {}".format(len(dataset.image_ids)))
print("Class Count: {}".format(dataset.num_classes))
for i, info in enumerate(dataset.class_info):
    print("{:3}. {:50}".format(i, info['name']))
loading annotations into memory...
Done (t=11.93s)
creating index...
index created!
Image Count: 82081
Class Count: 81
  0. BG
  1. person
  2. bicycle
  3. car
  4. motorcycle
  5. airplane
  6. bus
  7. train
  8. truck
  9. boat
 10. traffic light
 11. fire hydrant
 12. stop sign
 13. parking meter
 14. bench
 15. bird
 16. cat
 17. dog
 18. horse
 19. sheep
 20. cow
 21. elephant
 22. bear
 23. zebra
 24. giraffe
 25. backpack
 26. umbrella
 27. handbag
 28. tie
 29. suitcase
 30. frisbee
 31. skis
 32. snowboard
 33. sports ball
 34. kite
 35. baseball bat
 36. baseball glove
 37. skateboard
 38. surfboard
 39. tennis racket
 40. bottle
 41. wine glass
 42. cup
 43. fork
 44. knife
 45. spoon
 46. bowl
 47. banana
 48. apple
 49. sandwich
 50. orange
 51. broccoli
 52. carrot
 53. hot dog
 54. pizza
 55. donut
 56. cake
 57. chair
 58. couch
 59. potted plant
 60. bed
 61. dining table
 62. toilet
 63. tv
 64. laptop
 65. mouse
 66. remote
 67. keyboard
 68. cell phone
 69. microwave
 70. oven
 71. toaster
 72. sink
 73. refrigerator
 74. book
 75. clock
 76. vase
 77. scissors
 78. teddy bear
 79. hair drier
 80. toothbrush
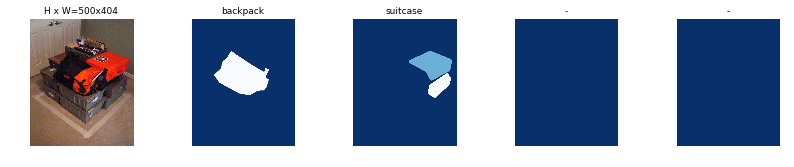
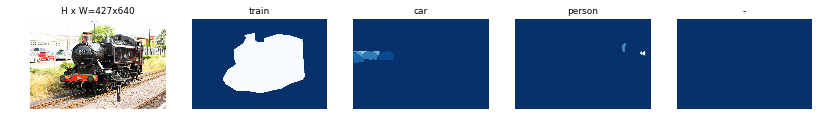
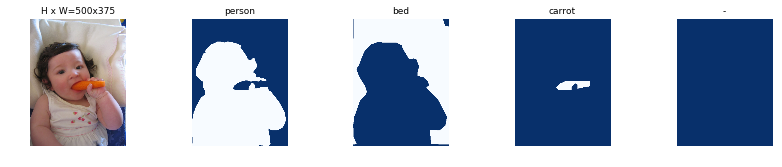
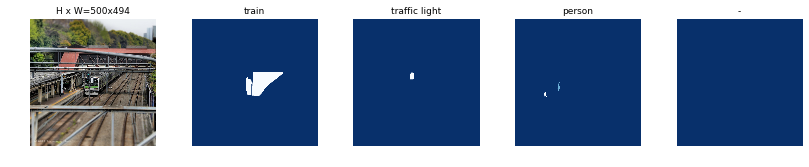
Display Samples#
Load and display images and masks.
# Load and display random samples
image_ids = np.random.choice(dataset.image_ids, 4)
for image_id in image_ids:
    image = dataset.load_image(image_id)
    mask, class_ids = dataset.load_mask(image_id)
    visualize.display_top_masks(image, mask, class_ids, dataset.class_names)
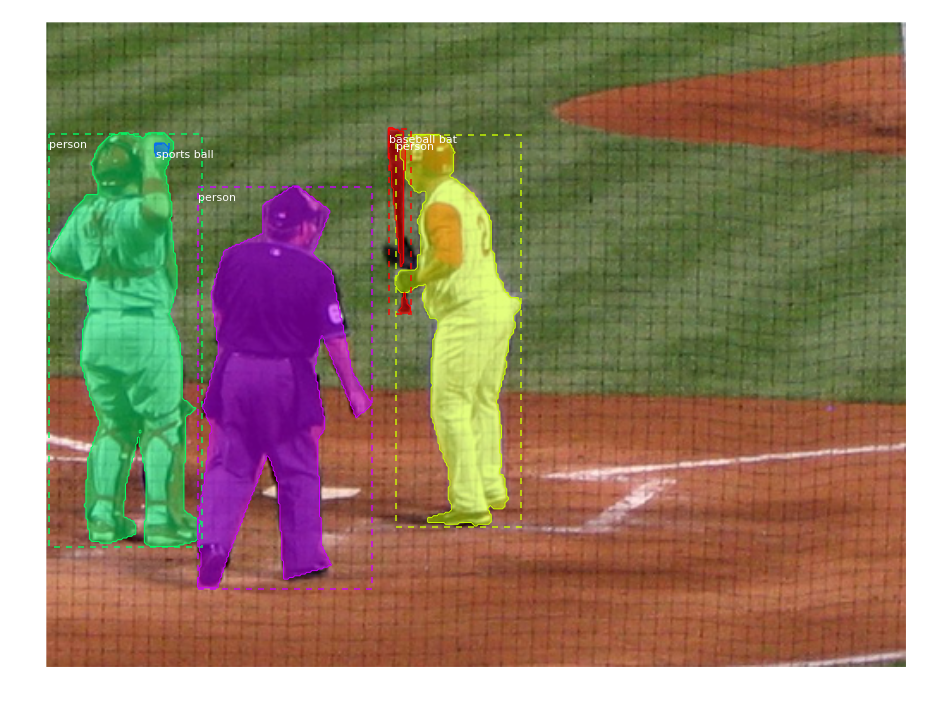
Bounding Boxes#
Rather than using bounding box coordinates provided by the source datasets, we compute the bounding boxes from masks instead. This allows us to handle bounding boxes consistently regardless of the source dataset, and it also makes it easier to resize, rotate, or crop images because we simply generate the bounding boxes from the updates masks rather than computing bounding box transformation for each type of image transformation.
# Load random image and mask.
image_id = random.choice(dataset.image_ids)
image = dataset.load_image(image_id)
mask, class_ids = dataset.load_mask(image_id)
# Compute Bounding box
bbox = utils.extract_bboxes(mask)

# Display image and additional stats
print("image_id ", image_id, dataset.image_reference(image_id))
log("image", image)
log("mask", mask)
log("class_ids", class_ids)
log("bbox", bbox)
# Display image and instances
visualize.display_instances(image, bbox, mask, class_ids, dataset.class_names)
image_id  74886 http://cocodataset.org/#explore?id=118535
image                    shape: (375, 500, 3)         min:    0.00000  max:  255.00000
mask                     shape: (375, 500, 5)         min:    0.00000  max:    1.00000
class_ids                shape: (5,)                  min:    1.00000  max:   35.00000
bbox                     shape: (5, 4)                min:    1.00000  max:  329.00000
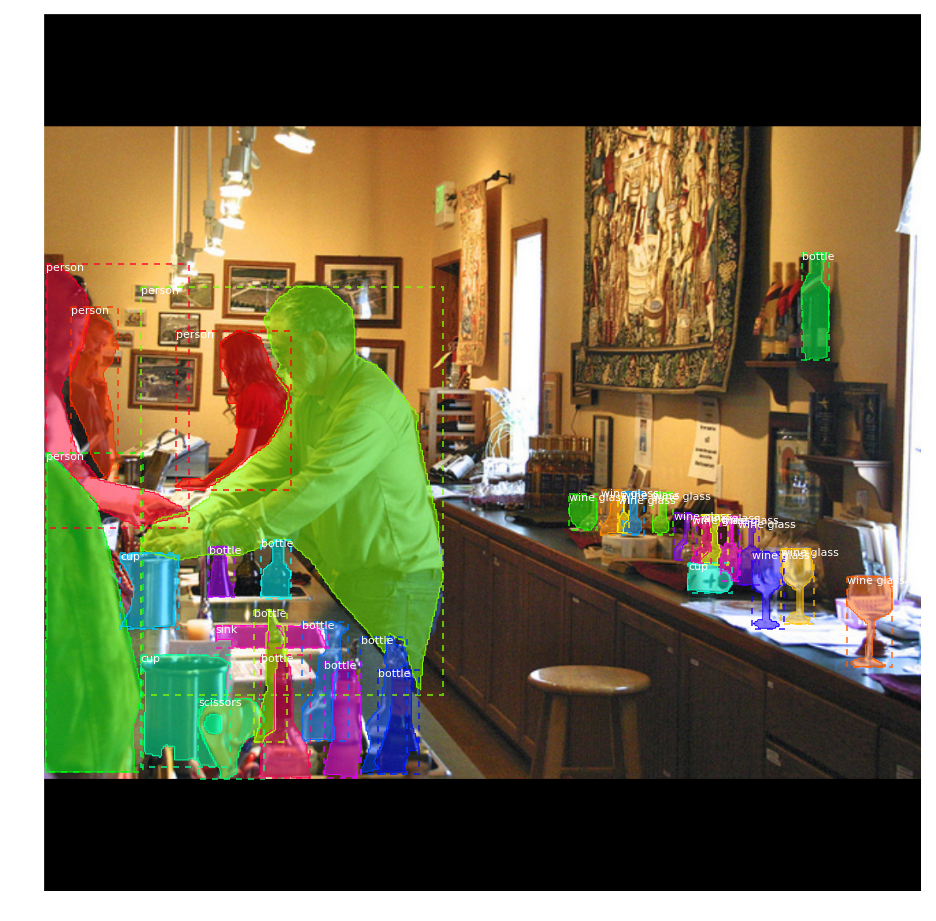
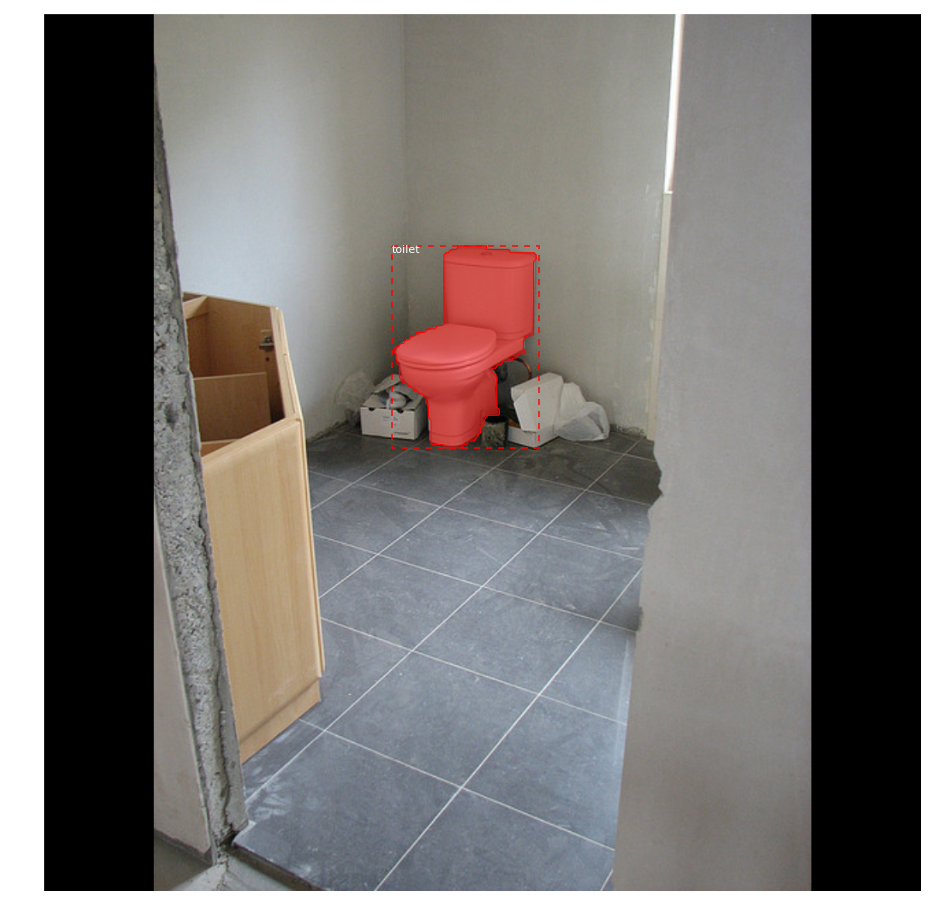
Resize Images#
To support multiple images per batch, images are resized to one size (1024x1024). Aspect ratio is preserved, though. If an image is not square, then zero padding is added at the top/bottom or right/left.
# Load random image and mask.
image_id = np.random.choice(dataset.image_ids, 1)[0]
image = dataset.load_image(image_id)
mask, class_ids = dataset.load_mask(image_id)
original_shape = image.shape
# Resize
image, window, scale, padding, _ = utils.resize_image(
    image,
    min_dim=config.IMAGE_MIN_DIM,
    max_dim=config.IMAGE_MAX_DIM,
    mode=config.IMAGE_RESIZE_MODE)
mask = utils.resize_mask(mask, scale, padding)
# Compute Bounding box
bbox = utils.extract_bboxes(mask)

# Display image and additional stats
print("image_id: ", image_id, dataset.image_reference(image_id))
print("Original shape: ", original_shape)
log("image", image)
log("mask", mask)
log("class_ids", class_ids)
log("bbox", bbox)
# Display image and instances
visualize.display_instances(image, bbox, mask, class_ids, dataset.class_names)
image_id:  6480 http://cocodataset.org/#explore?id=402563
Original shape:  (476, 640, 3)
image                    shape: (1024, 1024, 3)       min:    0.00000  max:  255.00000
mask                     shape: (1024, 1024, 32)      min:    0.00000  max:    1.00000
class_ids                shape: (32,)                 min:    1.00000  max:   77.00000
bbox                     shape: (32, 4)               min:    1.00000  max:  991.00000
/usr/local/lib/python3.5/dist-packages/scipy/ndimage/interpolation.py:600: UserWarning: From scipy 0.13.0, the output shape of zoom() is calculated with round() instead of int() - for these inputs the size of the returned array has changed.
  "the returned array has changed.", UserWarning)
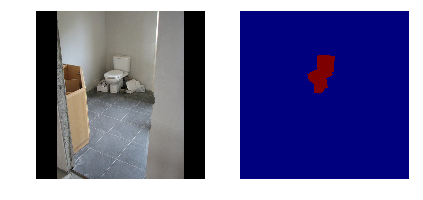
Mini Masks#
Instance binary masks can get large when training with high resolution images. For example, if training with 1024x1024 image then the mask of a single instance requires 1MB of memory (Numpy uses bytes for boolean values). If an image has 100 instances then that’s 100MB for the masks alone.
To improve training speed, we optimize masks by:
We store mask pixels that are inside the object bounding box, rather than a mask of the full image. Most objects are small compared to the image size, so we save space by not storing a lot of zeros around the object.
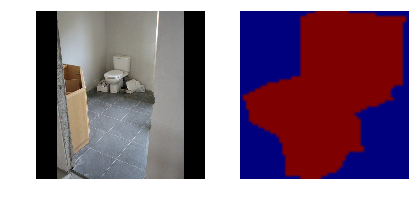
We resize the mask to a smaller size (e.g. 56x56). For objects that are larger than the selected size we lose a bit of accuracy. But most object annotations are not very accuracy to begin with, so this loss is negligable for most practical purposes. Thie size of the mini_mask can be set in the config class.
To visualize the effect of mask resizing, and to verify the code correctness, we visualize some examples.
image_id = np.random.choice(dataset.image_ids, 1)[0]
image, image_meta, class_ids, bbox, mask = modellib.load_image_gt(
    dataset, config, image_id, use_mini_mask=False)

log("image", image)
log("image_meta", image_meta)
log("class_ids", class_ids)
log("bbox", bbox)
log("mask", mask)

display_images([image]+[mask[:,:,i] for i in range(min(mask.shape[-1], 7))])
image                    shape: (1024, 1024, 3)       min:    0.00000  max:  255.00000
image_meta               shape: (89,)                 min:    0.00000  max: 23221.00000
bbox                     shape: (1, 5)                min:   62.00000  max:  578.00000
mask                     shape: (1024, 1024, 1)       min:    0.00000  max:    1.00000
visualize.display_instances(image, bbox, mask, class_ids, dataset.class_names)

# Add augmentation and mask resizing.
image, image_meta, class_ids, bbox, mask = modellib.load_image_gt(
    dataset, config, image_id, augment=True, use_mini_mask=True)
log("mask", mask)
display_images([image]+[mask[:,:,i] for i in range(min(mask.shape[-1], 7))])
mask shape: (56, 56, 1) min: 0.00000 max: 1.00000
mask = utils.expand_mask(bbox, mask, image.shape)
visualize.display_instances(image, bbox, mask, class_ids, dataset.class_names)
Anchors#
The order of anchors is important. Use the same order in training and prediction phases. And it must match the order of the convolution execution.
For an FPN network, the anchors must be ordered in a way that makes it easy to match anchors to the output of the convolution layers that predict anchor scores and shifts.
Sort by pyramid level first. All anchors of the first level, then all of the second and so on. This makes it easier to separate anchors by level.
Within each level, sort anchors by feature map processing sequence. Typically, a convolution layer processes a feature map starting from top-left and moving right row by row.
For each feature map cell, pick any sorting order for the anchors of different ratios. Here we match the order of ratios passed to the function.
Anchor Stride: In the FPN architecture, feature maps at the first few layers are high resolution. For example, if the input image is 1024x1024 then the feature map of the first layer is 256x256, which generates about 200K anchors (256x256x3). These anchors are 32x32 pixels and their stride relative to image pixels is 4 pixels, so there is a lot of overlap. We can reduce the load significantly if we generate anchors for every other cell in the feature map. A stride of 2 will cut the number of anchors by 4, for example.
In this implementation we use an anchor stride of 2, which is different from the paper.
# Generate Anchors
backbone_shapes = modellib.compute_backbone_shapes(config, config.IMAGE_SHAPE)
anchors = utils.generate_pyramid_anchors(config.RPN_ANCHOR_SCALES,
                                          config.RPN_ANCHOR_RATIOS,
                                          backbone_shapes,
                                          config.BACKBONE_STRIDES,
                                          config.RPN_ANCHOR_STRIDE)

# Print summary of anchors
num_levels = len(backbone_shapes)
anchors_per_cell = len(config.RPN_ANCHOR_RATIOS)
print("Count: ", anchors.shape[0])
print("Scales: ", config.RPN_ANCHOR_SCALES)
print("ratios: ", config.RPN_ANCHOR_RATIOS)
print("Anchors per Cell: ", anchors_per_cell)
print("Levels: ", num_levels)
anchors_per_level = []
for l in range(num_levels):
    num_cells = backbone_shapes[l][0] * backbone_shapes[l][1]
    anchors_per_level.append(anchors_per_cell * num_cells // config.RPN_ANCHOR_STRIDE**2)
    print("Anchors in Level {}: {}".format(l, anchors_per_level[l]))
Count:  65472
Scales:  (32, 64, 128, 256, 512)
ratios:  [0.5, 1, 2]
Anchors per Cell:  3
Levels:  5
Anchors in Level 0: 49152
Anchors in Level 1: 12288
Anchors in Level 2: 3072
Anchors in Level 3: 768
Anchors in Level 4: 192
Visualize anchors of one cell at the center of the feature map of a specific level.
## Visualize anchors of one cell at the center of the feature map of a specific level

# Load and draw random image
image_id = np.random.choice(dataset.image_ids, 1)[0]
image, image_meta, _, _, _ = modellib.load_image_gt(dataset, config, image_id)
fig, ax = plt.subplots(1, figsize=(10, 10))
ax.imshow(image)
levels = len(backbone_shapes)

for level in range(levels):
    colors = visualize.random_colors(levels)
    # Compute the index of the anchors at the center of the image
    level_start = sum(anchors_per_level[:level]) # sum of anchors of previous levels
    level_anchors = anchors[level_start:level_start+anchors_per_level[level]]
    print("Level {}. Anchors: {:6}  Feature map Shape: {}".format(level, level_anchors.shape[0],
                                                                  backbone_shapes[level]))
    center_cell = backbone_shapes[level] // 2
    center_cell_index = (center_cell[0] * backbone_shapes[level][1] + center_cell[1])
    level_center = center_cell_index * anchors_per_cell
    center_anchor = anchors_per_cell * (
        (center_cell[0] * backbone_shapes[level][1] / config.RPN_ANCHOR_STRIDE**2) \
        + center_cell[1] / config.RPN_ANCHOR_STRIDE)
    level_center = int(center_anchor)

    # Draw anchors. Brightness show the order in the array, dark to bright.
    for i, rect in enumerate(level_anchors[level_center:level_center+anchors_per_cell]):
        y1, x1, y2, x2 = rect
        p = patches.Rectangle((x1, y1), x2-x1, y2-y1, linewidth=2, facecolor='none',
                              edgecolor=(i+1)*np.array(colors[level]) / anchors_per_cell)
        ax.add_patch(p)
Level 0. Anchors:  49152  Feature map Shape: [256 256]
Level 1. Anchors:  12288  Feature map Shape: [128 128]
Level 2. Anchors:   3072  Feature map Shape: [64 64]
Level 3. Anchors:    768  Feature map Shape: [32 32]
Level 4. Anchors:    192  Feature map Shape: [16 16]
/usr/local/lib/python3.5/dist-packages/scipy/ndimage/interpolation.py:600: UserWarning: From scipy 0.13.0, the output shape of zoom() is calculated with round() instead of int() - for these inputs the size of the returned array has changed.
  "the returned array has changed.", UserWarning)
Data Generator#
# Create data generator
random_rois = 2000
g = modellib.data_generator(
    dataset, config, shuffle=True, random_rois=random_rois,
    batch_size=4,
    detection_targets=True)
# Uncomment to run the generator through a lot of images
# to catch rare errors
# for i in range(1000):
#     print(i)
#     _, _ = next(g)
# Get Next Image
if random_rois:
    [normalized_images, image_meta, rpn_match, rpn_bbox, gt_class_ids, gt_boxes, gt_masks, rpn_rois, rois], \
    [mrcnn_class_ids, mrcnn_bbox, mrcnn_mask] = next(g)

    log("rois", rois)
    log("mrcnn_class_ids", mrcnn_class_ids)
    log("mrcnn_bbox", mrcnn_bbox)
    log("mrcnn_mask", mrcnn_mask)
else:
    [normalized_images, image_meta, rpn_match, rpn_bbox, gt_boxes, gt_masks], _ = next(g)

log("gt_class_ids", gt_class_ids)
log("gt_boxes", gt_boxes)
log("gt_masks", gt_masks)
log("rpn_match", rpn_match, )
log("rpn_bbox", rpn_bbox)
image_id = modellib.parse_image_meta(image_meta)["image_id"][0]
print("image_id: ", image_id, dataset.image_reference(image_id))

# Remove the last dim in mrcnn_class_ids. It's only added
# to satisfy Keras restriction on target shape.
mrcnn_class_ids = mrcnn_class_ids[:,:,0]
rois                     shape: (4, 128, 4)           min:    0.00000  max: 1023.00000
mrcnn_class_ids          shape: (4, 128, 1)           min:    0.00000  max:   67.00000
mrcnn_bbox               shape: (4, 128, 81, 5)       min:   -3.58824  max:    3.45455
mrcnn_mask               shape: (4, 128, 28, 28, 81)  min:    0.00000  max:    1.00000
gt_boxes                 shape: (4, 100, 5)           min:    0.00000  max: 1024.00000
gt_masks                 shape: (4, 56, 56, 100)      min:    0.00000  max:    1.00000
rpn_match                shape: (4, 65472, 1)         min:   -1.00000  max:    1.00000
rpn_bbox                 shape: (4, 256, 4)           min:   -4.60969  max:    1.76777
image_id:  2937 http://cocodataset.org/#explore?id=135453
/usr/local/lib/python3.5/dist-packages/scipy/ndimage/interpolation.py:600: UserWarning: From scipy 0.13.0, the output shape of zoom() is calculated with round() instead of int() - for these inputs the size of the returned array has changed.
  "the returned array has changed.", UserWarning)
b = 0

# Restore original image (reverse normalization)
sample_image = modellib.unmold_image(normalized_images[b], config)

# Compute anchor shifts.
indices = np.where(rpn_match[b] == 1)[0]
refined_anchors = utils.apply_box_deltas(anchors[indices], rpn_bbox[b, :len(indices)] * config.RPN_BBOX_STD_DEV)
log("anchors", anchors)
log("refined_anchors", refined_anchors)

# Get list of positive anchors
positive_anchor_ids = np.where(rpn_match[b] == 1)[0]
print("Positive anchors: {}".format(len(positive_anchor_ids)))
negative_anchor_ids = np.where(rpn_match[b] == -1)[0]
print("Negative anchors: {}".format(len(negative_anchor_ids)))
neutral_anchor_ids = np.where(rpn_match[b] == 0)[0]
print("Neutral anchors: {}".format(len(neutral_anchor_ids)))

# ROI breakdown by class
for c, n in zip(dataset.class_names, np.bincount(mrcnn_class_ids[b].flatten())):
    if n:
        print("{:23}: {}".format(c[:20], n))

# Show positive anchors
visualize.draw_boxes(sample_image, boxes=anchors[positive_anchor_ids],
                     refined_boxes=refined_anchors)
anchors                  shape: (65472, 4)            min: -362.03867  max: 1258.03867
refined_anchors          shape: (4, 4)                min:  112.99997  max:  912.00000
Positive anchors: 4
Negative anchors: 252
Neutral anchors: 65216
BG                     : 90
chair                  : 6
bed                    : 30
remote                 : 2

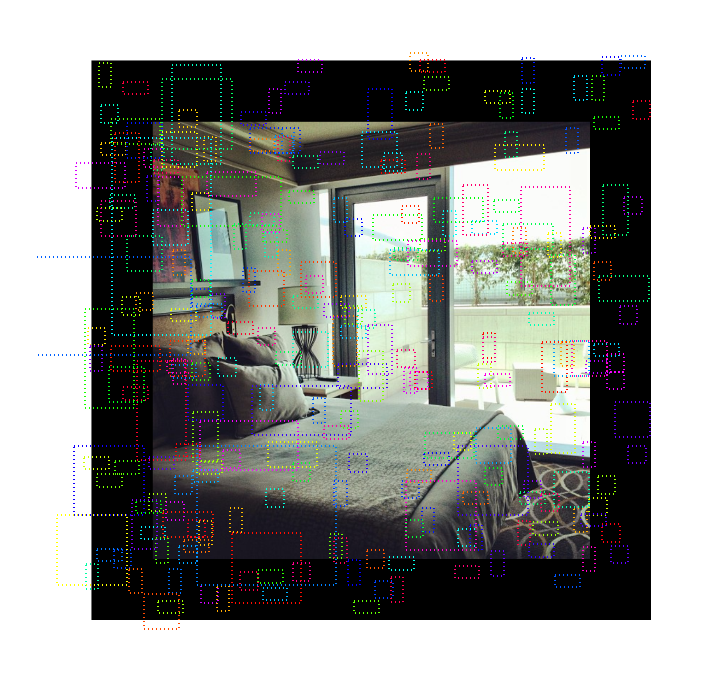
# Show negative anchors
visualize.draw_boxes(sample_image, boxes=anchors[negative_anchor_ids])
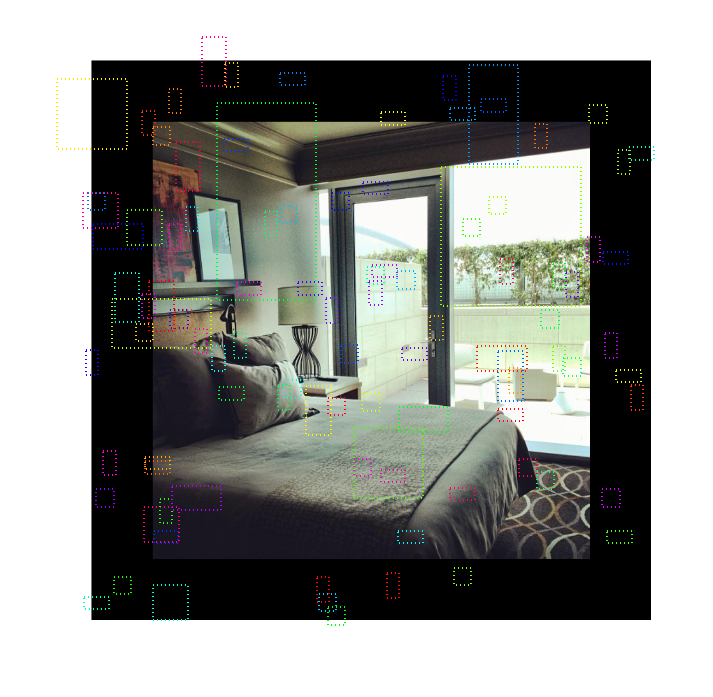
# Show neutral anchors. They don't contribute to training.
visualize.draw_boxes(sample_image, boxes=anchors[np.random.choice(neutral_anchor_ids, 100)])
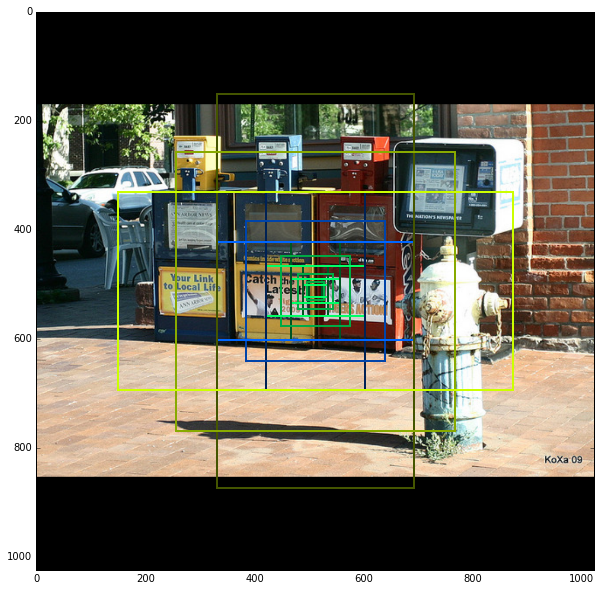
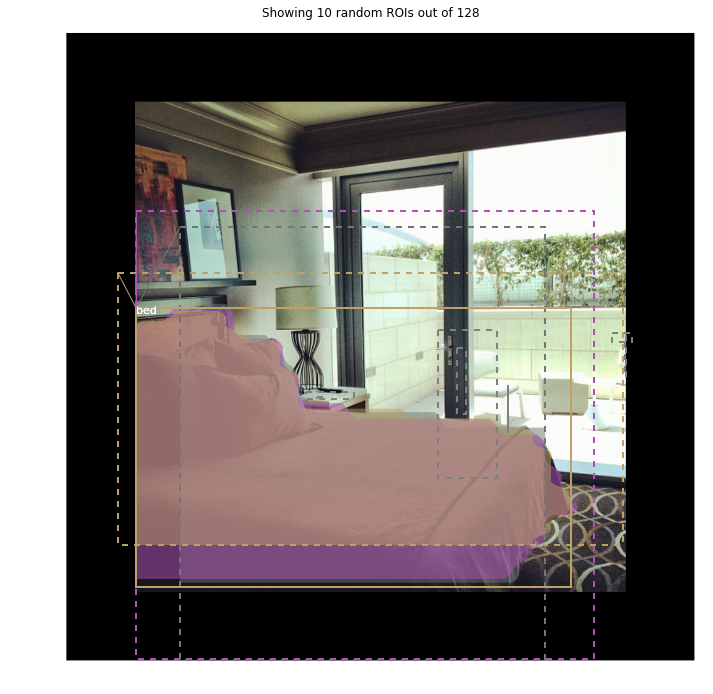
ROIs#
if random_rois:
    # Class aware bboxes
    bbox_specific = mrcnn_bbox[b, np.arange(mrcnn_bbox.shape[1]), mrcnn_class_ids[b], :]

    # Refined ROIs
    refined_rois = utils.apply_box_deltas(rois[b].astype(np.float32), bbox_specific[:,:4] * config.BBOX_STD_DEV)

    # Class aware masks
    mask_specific = mrcnn_mask[b, np.arange(mrcnn_mask.shape[1]), :, :, mrcnn_class_ids[b]]

    visualize.draw_rois(sample_image, rois[b], refined_rois, mask_specific, mrcnn_class_ids[b], dataset.class_names)

    # Any repeated ROIs?
    rows = np.ascontiguousarray(rois[b]).view(np.dtype((np.void, rois.dtype.itemsize * rois.shape[-1])))
    _, idx = np.unique(rows, return_index=True)
    print("Unique ROIs: {} out of {}".format(len(idx), rois.shape[1]))
Positive ROIs:  38
Negative ROIs:  90
Positive Ratio: 0.30
Unique ROIs: 128 out of 128
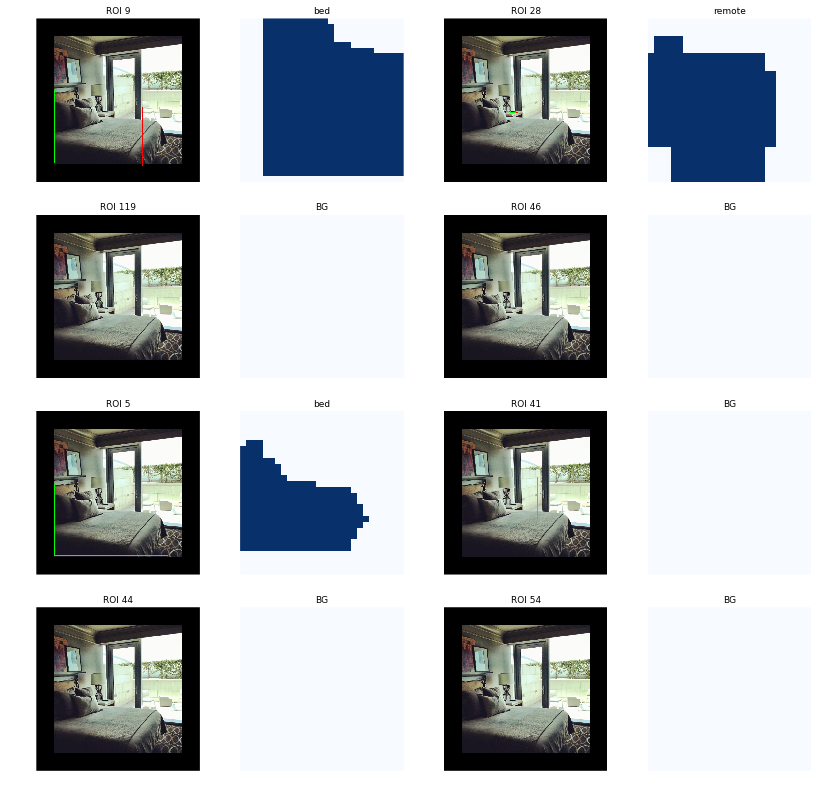
if random_rois:
    # Dispalay ROIs and corresponding masks and bounding boxes
    ids = random.sample(range(rois.shape[1]), 8)

    images = []
    titles = []
    for i in ids:
        image = visualize.draw_box(sample_image.copy(), rois[b,i,:4].astype(np.int32), [255, 0, 0])
        image = visualize.draw_box(image, refined_rois[i].astype(np.int64), [0, 255, 0])
        images.append(image)
        titles.append("ROI {}".format(i))
        images.append(mask_specific[i] * 255)
        titles.append(dataset.class_names[mrcnn_class_ids[b,i]][:20])

    display_images(images, titles, cols=4, cmap="Blues", interpolation="none")
# Check ratio of positive ROIs in a set of images.
if random_rois:
    limit = 10
    temp_g = modellib.data_generator(
        dataset, config, shuffle=True, random_rois=10000,
        batch_size=1, detection_targets=True)
    total = 0
    for i in range(limit):
        _, [ids, _, _] = next(temp_g)
        positive_rois = np.sum(ids[0] > 0)
        total += positive_rois
        print("{:5} {:5.2f}".format(positive_rois, positive_rois/ids.shape[1]))
    print("Average percent: {:.2f}".format(total/(limit*ids.shape[1])))
   42  0.33
   42  0.33
   42  0.33
   42  0.33
   42  0.33
   42  0.33
   42  0.33
   42  0.33
   42  0.33
   42  0.33
Average percent: 0.33
/usr/local/lib/python3.5/dist-packages/scipy/ndimage/interpolation.py:600: UserWarning: From scipy 0.13.0, the output shape of zoom() is calculated with round() instead of int() - for these inputs the size of the returned array has changed.
  "the returned array has changed.", UserWarning)