import numpy as np
import matplotlib.pyplot as plt
import matplotlib.patches as patchesPolicy Iteration Gridworld
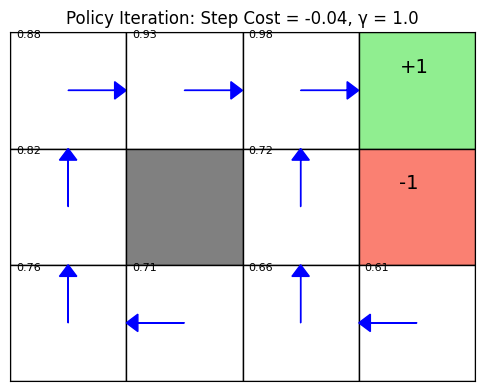
This notebook implements policy iteration for the classic 4x3 grid world example in Artificial Intelligence: A Modern Approach, Figure 17.2.
- Terminal states: +1 at (3,0), -1 at (3,1)
- Wall: (1,1)
- Step cost: -0.04
- Discount factor γ = 1.0
# Define state positions and mappings
state_coords = {
    0: (0, 0), 1: (1, 0), 2: (2, 0), 3: (3, 0),
    4: (0, 1), 5: (1, 1), 6: (2, 1), 7: (3, 1),
    8: (0, 2), 9: (1, 2), 10: (2, 2), 11: (3, 2)
}

terminal_states = {3: 1.0, 7: -1.0}
wall = {5}
states = list(range(12))
actions = [0, 1, 2, 3]  # east, north, south, west
step_cost = -0.04
gamma = 1.0
theta = 1e-4

action_delta = {0: (1, 0), 1: (0, -1), 2: (0, 1), 3: (-1, 0)}
state_pos = {s: (x, y) for s, (x, y) in state_coords.items()}
pos_state = {v: k for k, v in state_pos.items()}

def get_transitions(s, a):
    if s in terminal_states or s in wall:
        return [(1.0, s)]
    x, y = state_pos[s]
    results = []
    for prob, direction in zip([0.8, 0.1, 0.1], [a, (a+1)%4, (a+3)%4]):
        dx, dy = action_delta[direction]
        nx, ny = x + dx, y + dy
        ns = pos_state.get((nx, ny), s)
        if ns in wall:
            ns = s
        results.append((prob, ns))
    return results
v = [0.0 for _ in states]
policy = [0 if s not in terminal_states and s not in wall else None for s in states]

is_policy_stable = False
while not is_policy_stable:
    while True:
        delta = 0
        for s in states:
            if s in terminal_states or s in wall:
                continue
            v_old = v[s]
            v[s] = sum(prob * (terminal_states.get(s_next, step_cost) + gamma * v[s_next])
                       for prob, s_next in get_transitions(s, policy[s]))
            delta = max(delta, abs(v_old - v[s]))
        if delta < theta:
            break

    is_policy_stable = True
    for s in states:
        if s in terminal_states or s in wall:
            continue
        old_action = policy[s]
        q_vals = []
        for a in actions:
            q = sum(prob * (terminal_states.get(s_next, step_cost) + gamma * v[s_next])
                    for prob, s_next in get_transitions(s, a))
            q_vals.append(q)
        best_action = int(np.argmax(q_vals))
        policy[s] = best_action
        if best_action != old_action:
            is_policy_stable = False
arrow_map = {0: (0.4, 0), 1: (0, -0.4), 2: (0, 0.4), 3: (-0.4, 0)}

fig, ax = plt.subplots(figsize=(6, 5))
for s, (x, y) in state_coords.items():
    if s in wall:
        color = 'gray'
    elif s in terminal_states:
        color = 'lightgreen' if terminal_states[s] > 0 else 'salmon'
    else:
        color = 'white'
    ax.add_patch(patches.Rectangle((x, y), 1, 1, edgecolor='black', facecolor=color))
    if s not in terminal_states and s not in wall:
        dx, dy = arrow_map[policy[s]]
        ax.arrow(x + 0.5, y + 0.5, dx, dy, head_width=0.15, head_length=0.1, fc='blue', ec='blue')
        ax.text(x + 0.05, y + 0.05, f"{v[s]:.2f}", fontsize=8, color='black')

for s, r in terminal_states.items():
    x, y = state_coords[s]
    ax.text(x + 0.35, y + 0.35, f"{r:+.0f}", fontsize=14, color='black')

ax.set_xlim(0, 4)
ax.set_ylim(0, 3)
ax.set_xticks([])
ax.set_yticks([])
ax.set_aspect('equal')
plt.title("Policy Iteration: Step Cost = -0.04, γ = 1.0")
plt.gca().invert_yaxis()
plt.show()