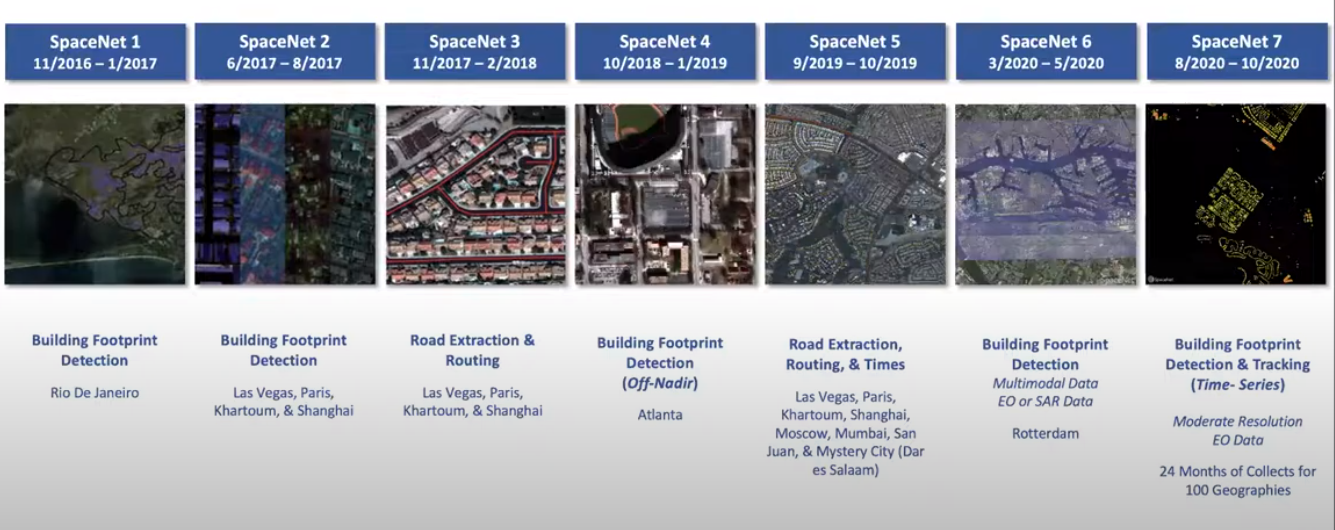
Semantic Map from Building and Road Detections#

In this project you will construct a semantic map. This project is challenging enough that you don’t need to break new ground in terms of delivering something new. It will very useful in your future endeavors with ML/AI and expose you to real world pipelines.
Each team needs to select and focus in developing / testing a pipeline that works on either buildings or roads - not both.
Watch the video below to understand SpaceNet challenges especially associated with building footprint (SN-2) and road detection (SN-5).
All data required can be downloaded from: https://spacenet.ai/datasets/ Message your Projects Slack if you have any issues with data access.
Road Detection#

Fork the repo
Build the pipeline environment using conda in a Google Colab. Not everything has to be in a notebook. Learn how you can have a mix of
.pyand a main.ipynbnotebook that calls everything needed for the task to run on GPU (20 points).
NOTE: If you have a local desktop with a GPU you can go down the Docker path which is suggested and provided in the repo. Docker is a standard tool you need to learn how to use it.
Run the pipeline on one city of your choice (data must be in your Gdrive). Select a city like Paris that does not depend on too much data for minimizing your storage footprint. You can also watch this short segment video to understand the result that the authors produced. (40 points)
Author a writeup of (a) the challenges you faced in replicating the resultant data structure (the graph). (b) Explain how the detector works using a block diagram (in draw.io format) to point to all the stages and their function they perform. (40 points)
Building Detection#

Fork the repo
Build the pipeline environment using conda in a Google Colab. Not everything has to be in a notebook. Learn how you can have a mix of
.pyand a main.ipynbnotebook that calls everything needed for the task to run on GPU (20 points).
NOTE: If you have a local desktop with a GPU you can go down the Docker path which is suggested and provided in the repo. Docker is a standard tool you need to learn how to use it.
Run the pipeline on one city of your choice (data must be in your Gdrive). Select a city like Paris that does not depend on too much data for minimizing your storage footprint. (40 points)
Author a writeup of (a) the challenges you faced in replicating the resultant detections. (b) Explain how the detector works using a block diagram (in draw.io format) to point to all the stages and their function they perform. (40 points)
