Separating Perception and Reasoning via Relation Networks
Purely symbolic approaches to artificial intelligence are inherently relational. Practitioners define the relations between symbols using the language of logic and mathematics, and then reason about these relations using a multitude of powerful methods, including deduction, arithmetic, and algebra. But symbolic approaches suffer from the symbol grounding problem and are not robust to small task and input variations. Other approaches, such as those based on statistical learning, build representations from raw data and often generalize across diverse and noisy conditions. However, a number of these approaches, such as deep learning, often struggle in data-poor problems where the underlying structure is characterized by sparse but complex relations.
In this project you will study the implementation of AI approaches that offer the ability to combine neural and symbolic representations in their attempt to answer the so called Visual Question-Answer task.
The approach here is based on relation networks and is considered a milestone in the development of such capability due to its simplicity and representational flexibility.
Relation Networks (by DeepMind)
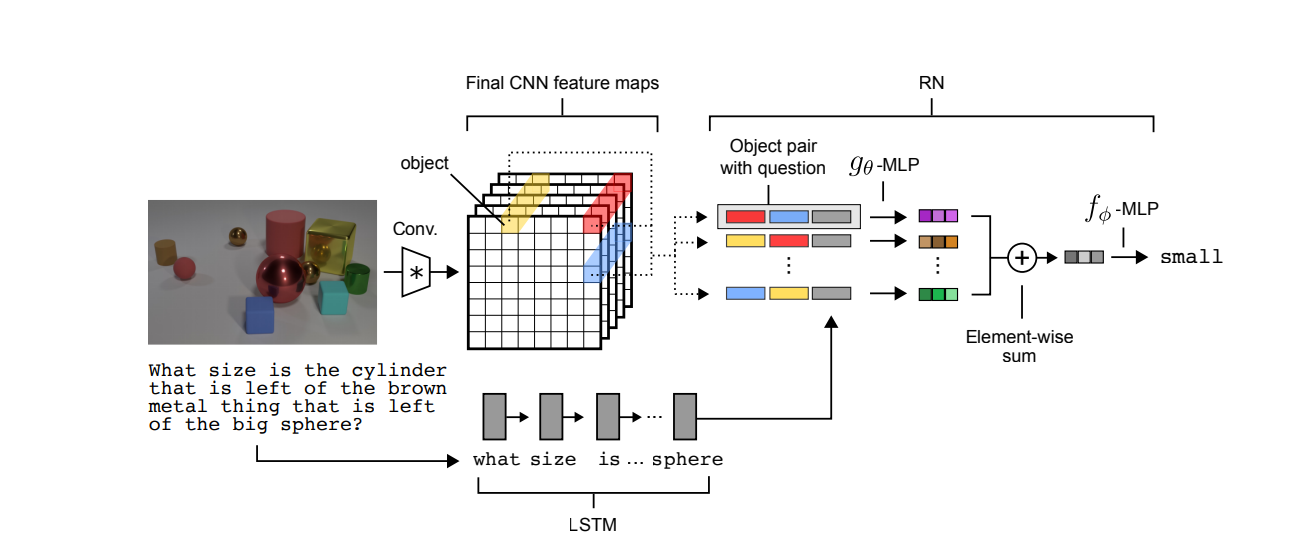
In this project you will create Relation Networks that can act as plugins to state of the art video understanding systems offering not just the ability to answer questions regarding a scene but also influence the representations they generate by considering relationships between objects. In this seminal paper the authors present their method that can reveal relations between objects from a variety of representational formats.
Describe the RN (20 points)
In a tutorial fashion describe the RN approach. You can either create a lengthy markdown report (at least 2 pages) or preferably put comments inline with the code (or using markdown cells).
QA on Sort-of-CLEVR (80 points)
You can start with this repo.
Sort-of-CLEVR is composed of 10000 images and 20 questions (10 relational questions and 10 non-relational questions) per each image. 6 colors (red, green, blue, orange, gray, yellow) are assigned to randomly chosen shape (square or circle), and placed in a image.
(40 points) Replicate the sort-of-CLEVR dataset result of the paper as quoted in the section 5.3. Please focus only on the CNN, augmented with RN, case.
(40 points) Perform the “state description” task and create a table that represents the state of each image. The columns of the state table are described at the end of section 3.1 and repeated below. You can use a sql database or a data structure (eg python dict or data frame ) to persist the tabular state.
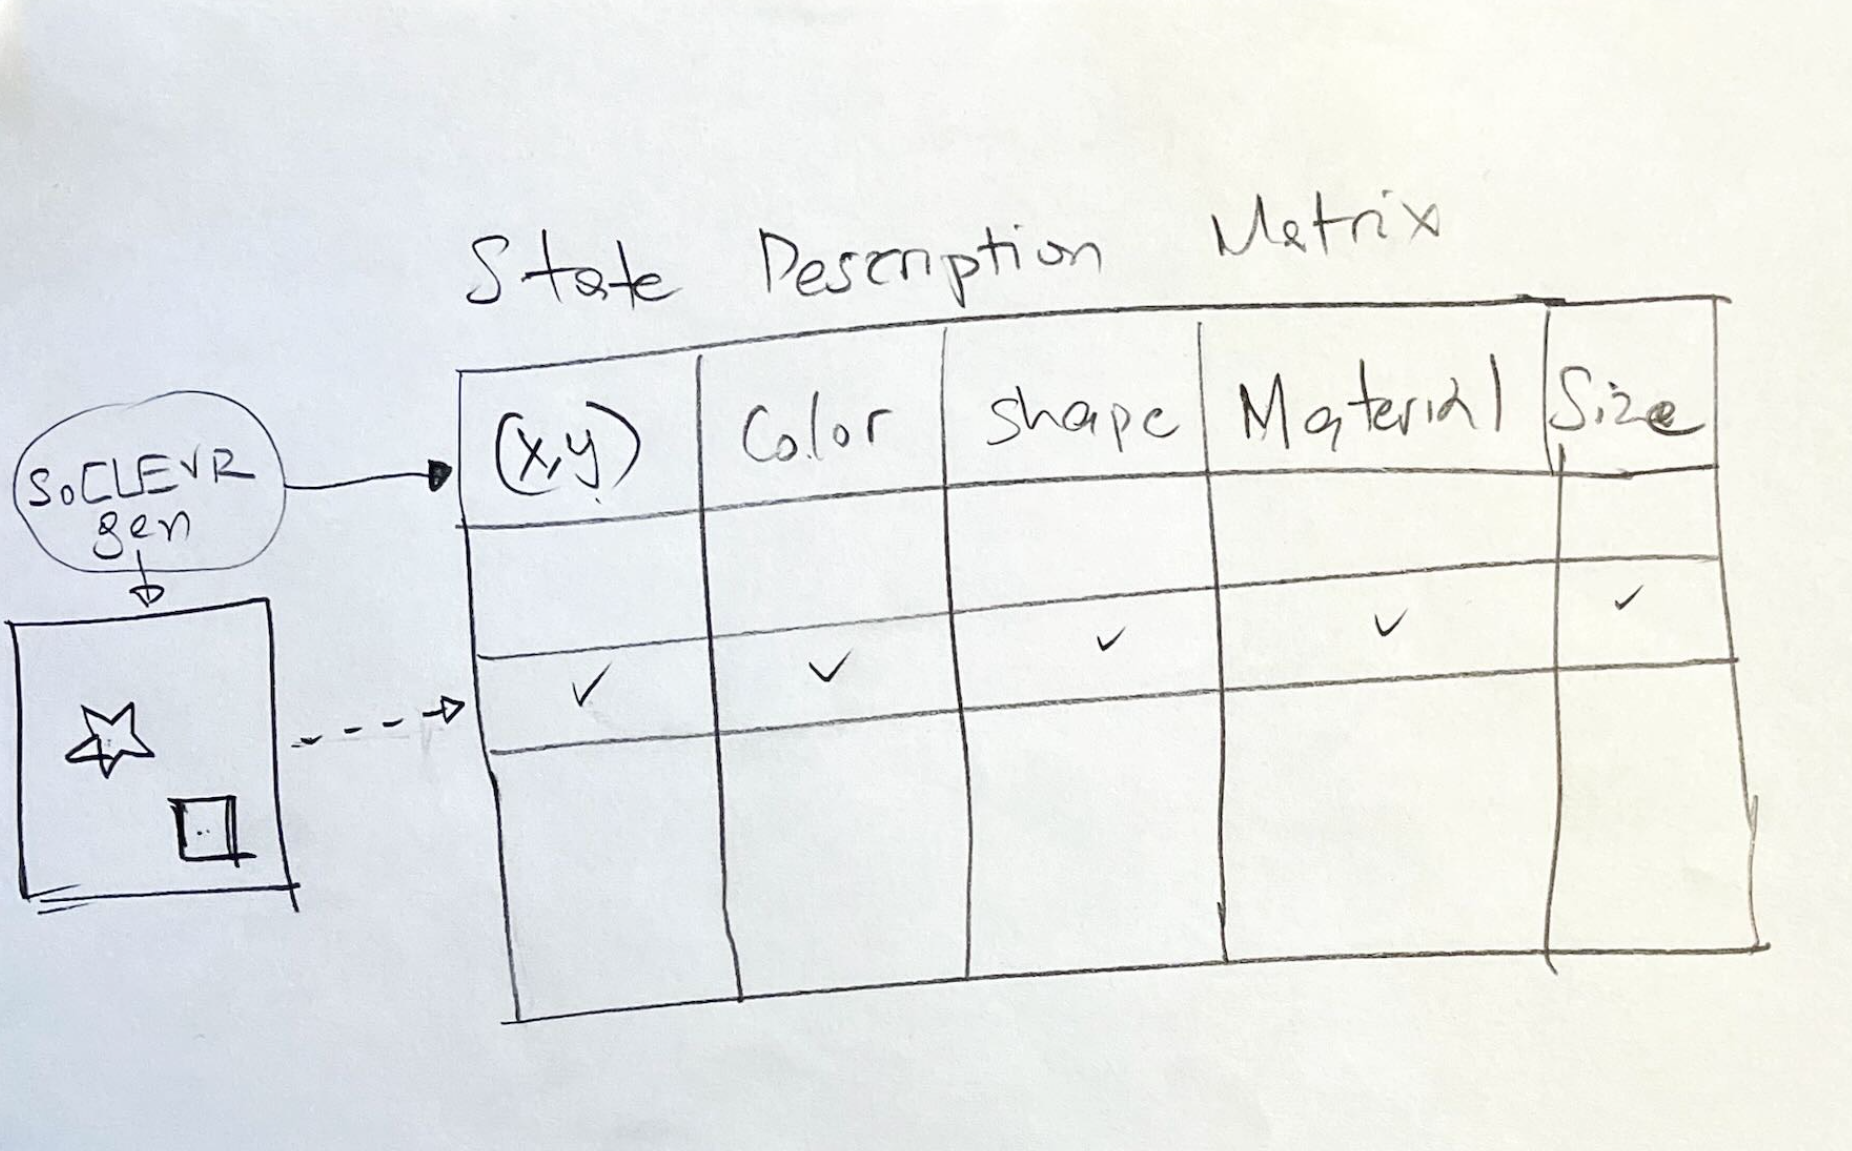
PS: Those that have exposure to 3D world modeling tooling such as NVIDIA’s Omniverse, will appreciate the connection between the innocent “state description” table and Pixar’s Universal Scene Description (USD) markup.
Extra Credit 1 (5 points)
Usage of Hydra for configuration and use Ray to learn how to create distributed execution pipelines.
The purpose of this extra credit is to motivate you to develop your repositories not for you but for your audience that may include future employers. Please note that distributed processing based on Ray can still be done in your laptops using the CPU cores as workers as well as in Google Colab using even TPUs.
Extra Credit 2 (5 points)
Use of JAX libraries.
Further study
There are also newer key developments in the VQA space such as:
J. Shi, H. Zhang, and J. Li, “Explainable and explicit visual reasoning over scene graphs,” in 2019 IEEE/CVF Conference on Computer Vision and Pattern Recognition (CVPR), Long Beach, CA, USA, Jun. 2019, doi: 10.1109/cvpr.2019.00857 [Online]. Available: https://ieeexplore.ieee.org/document/8953666/.
You may continue the exploration after this course by studying approaches that use scene graphs such as the above. Talk to your professor if you want to pursue this.