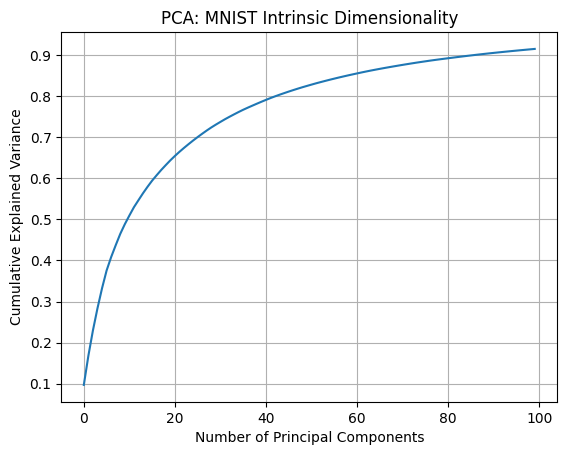
The MNIST data live in a fairly small number of dimensions as shown with a simple PCA exercise.
from sklearn.decomposition import PCAfrom torchvision.datasets import MNISTfrom torchvision import transformsimport matplotlib.pyplot as pltimport numpy as npimport torch# Load MNISTtransform = transforms.ToTensor()mnist = MNIST(root='./data', train=True, transform=transform, download=True)X = torch.stack([img for img, _ in mnist]).view(-1, 28*28).numpy()# Apply PCApca = PCA(n_components=100)X_pca = pca.fit_transform(X)# Plot explained varianceplt.plot(np.cumsum(pca.explained_variance_ratio_))plt.xlabel('Number of Principal Components')plt.ylabel('Cumulative Explained Variance')plt.title('PCA: MNIST Intrinsic Dimensionality')plt.grid(True)plt.show()
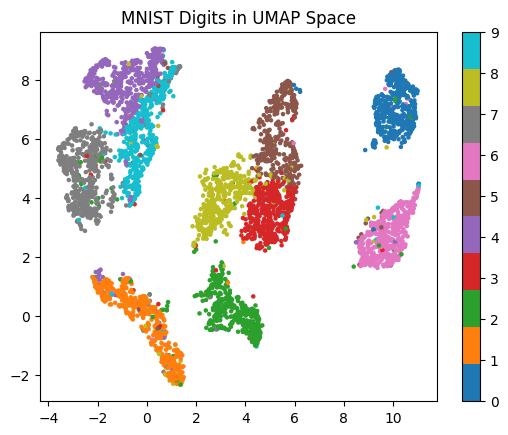
We can visualize the manifold the digits lie on as well with UMAP.
import umap.umap_ as umap# Reduce to 2D using UMAPX_2d = umap.UMAP(n_components=2).fit_transform(X[:5000])y = [label for _, label in mnist][:5000]# Plotplt.scatter(X_2d[:,0], X_2d[:,1], c=y, cmap='tab10', s=5)plt.colorbar()plt.title("MNIST Digits in UMAP Space")plt.show()
/workspaces/engineering-ai-agents/.venv/lib/python3.11/site-packages/sklearn/utils/deprecation.py:151: FutureWarning: 'force_all_finite' was renamed to 'ensure_all_finite' in 1.6 and will be removed in 1.8.
  warnings.warn(