# Plotting both the original vector and the softmax-transformed vector
plt.figure(figsize=(12, 6))
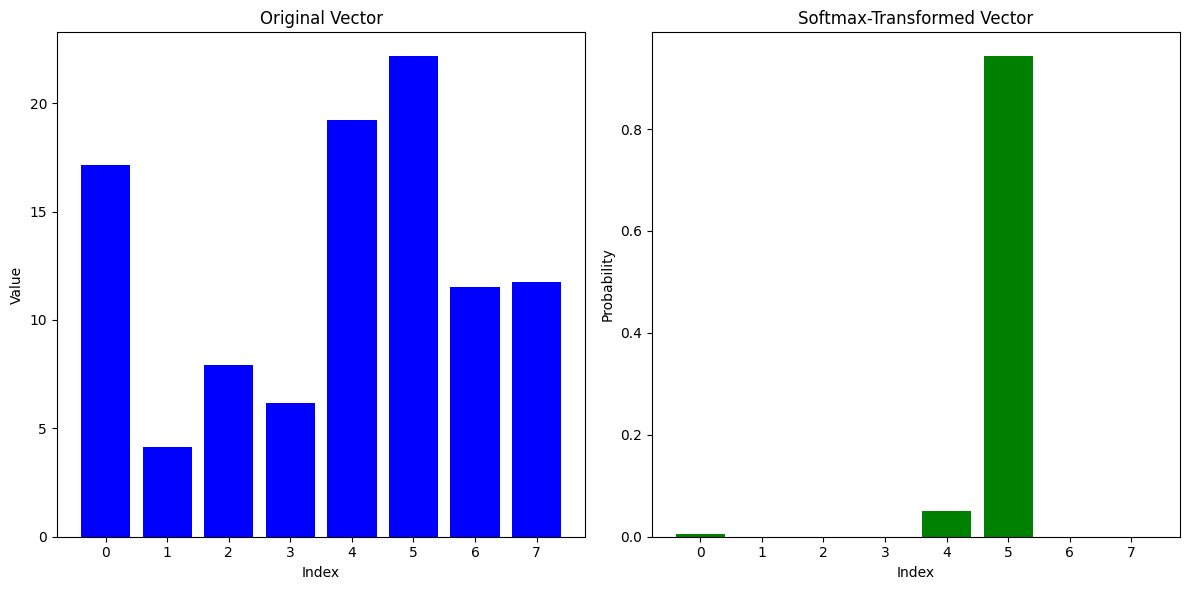
# Plot for the original vector
plt.subplot(1, 2, 1)
plt.bar(range(len(vector)), vector, color='blue')
plt.title("Original Vector")
plt.xlabel("Index")
plt.ylabel("Value")
# Plot for the softmax-transformed vector
plt.subplot(1, 2, 2)
plt.bar(range(len(softmax_vector)), softmax_vector, color='green')
plt.title("Softmax-Transformed Vector")
plt.xlabel("Index")
plt.ylabel("Probability")
plt.tight_layout()
plt.show()