State | Action A | Action B s1s_1s1 | s2s_2s2 +2 | s1s_1s1 +0 s2s_2s2 | s1s_1s1 +0 | s2s_2s2 +0
import numpy as np
import matplotlib.pyplot as plt
# States: s1, s2 (index 0 and 1)
gamma = 0.9
# Transition model: (next_state, reward)
# Actions: 0 = A (move), 1 = B (stay)
P = {
0: { # from state 0
0: (1, 2), # action A -> s2, reward 2
1: (0, 0) # action B -> s1, reward 0
},
1: { # from state 1
0: (0, 0), # action A -> s1, reward 0
1: (1, 0) # action B -> s2, reward 0
}
}
def value_iteration(epsilon=1e-5):
v = np.zeros(2)
v_history = [v.copy()]
iteration = 0
while True:
v_new = np.zeros(2)
for s in [0, 1]:
v_new[s] = max(
P[s][a][1] + gamma * v[P[s][a][0]] for a in [0, 1]
)
v_history.append(v_new.copy())
if np.max(np.abs(v_new - v)) < epsilon:
break
v = v_new
iteration += 1
print(f"Value Iteration converged in {iteration} iterations")
return v, v_history
def policy_iteration():
policy = np.zeros(2, dtype=int)
v_history = []
iteration = 0
stable = False
while not stable:
# Policy Evaluation (solve for v_pi exactly)
A = np.eye(2)
b = np.zeros(2)
for s in [0, 1]:
next_s, reward = P[s][policy[s]]
A[s, next_s] -= gamma
b[s] = reward
v = np.linalg.solve(A, b)
v_history.append(v.copy())
# Policy Improvement
stable = True
for s in [0, 1]:
old_action = policy[s]
action_values = [
P[s][a][1] + gamma * v[P[s][a][0]] for a in [0, 1]
]
policy[s] = np.argmax(action_values)
if policy[s] != old_action:
stable = False
iteration += 1
print(f"Policy Iteration converged in {iteration} iterations")
return policy, v, v_history
# Run value iteration
v_star, v_history_value = value_iteration()
v_history_value = np.array(v_history_value)
# Run policy iteration
optimal_policy, v_pi, v_history_policy = policy_iteration()
v_history_policy = np.array(v_history_policy)
# Plotting
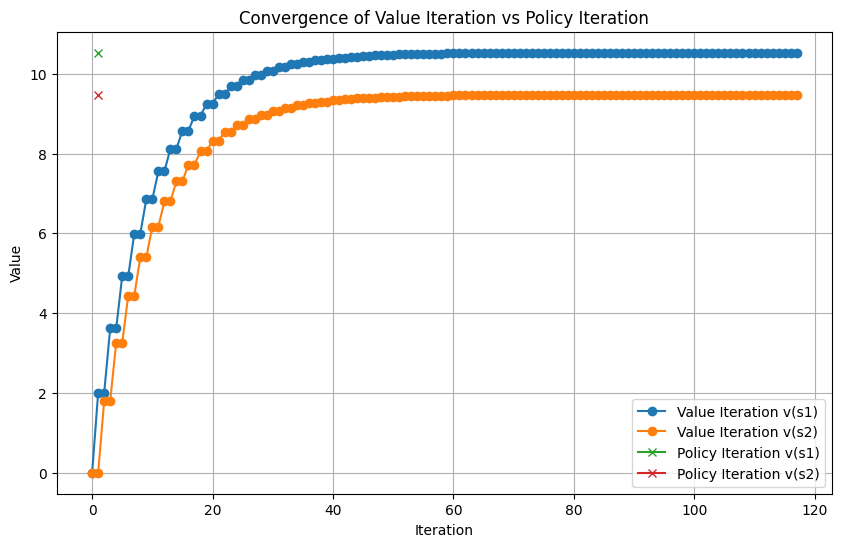
plt.figure(figsize=(10, 6))
plt.plot(v_history_value[:, 0], label="Value Iteration v(s1)", marker='o')
plt.plot(v_history_value[:, 1], label="Value Iteration v(s2)", marker='o')
plt.plot(np.arange(1, len(v_history_policy)+1), v_history_policy[:, 0], label="Policy Iteration v(s1)", marker='x')
plt.plot(np.arange(1, len(v_history_policy)+1), v_history_policy[:, 1], label="Policy Iteration v(s2)", marker='x')
plt.xlabel('Iteration')
plt.ylabel('Value')
plt.title('Convergence of Value Iteration vs Policy Iteration')
plt.grid(True)
plt.legend()
plt.show()
Value Iteration converged in 116 iterations
Policy Iteration converged in 1 iterations