%matplotlib inline
from matplotlib import rc
rc("animation", html="jshtml")
import numpy as np
import matplotlib.pyplot as plt
from matplotlib.animation import FuncAnimation
# Parameters
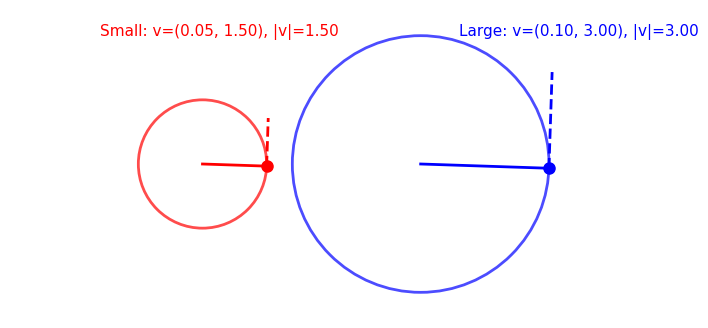
R1 = 1.0 # small wheel radius
R2 = 2.0 # large wheel radius
omega = 1.5 # angular speed (rad/s)
fps = 60
interval = 1000 / fps # ms
T = 2 * np.pi / omega
fig, ax = plt.subplots(figsize=(10, 4))
ax.set_aspect("equal")
ax.set_xlim(-R2 * 1.5, R2 * 3)
ax.set_ylim(-R2 * 1.2, R2 * 1.2)
ax.axis("off")
# Add wheels
wheel1 = plt.Circle((0, 0), R1, fill=False, lw=2, color="red", alpha=0.7)
wheel2 = plt.Circle((R2 * 1.7, 0), R2, fill=False, lw=2, color="blue", alpha=0.7)
ax.add_patch(wheel1)
ax.add_patch(wheel2)
# Points
(point1,) = ax.plot([], [], "ro", markersize=8)
(point2,) = ax.plot([], [], "bo", markersize=8)
# Radius lines
(radius_line1,) = ax.plot([], [], "r-", lw=2)
(radius_line2,) = ax.plot([], [], "b-", lw=2)
# Tangent (velocity) vectors
(velocity_line1,) = ax.plot([], [], "r--", lw=2)
(velocity_line2,) = ax.plot([], [], "b--", lw=2)
# Texts for displaying velocity magnitude
velocity_text1 = ax.text(-R2 * 0.8, R2 * 1.0, "", color="red", fontsize=11)
velocity_text2 = ax.text(R2 * 2.0, R2 * 1.0, "", color="blue", fontsize=11)
def init():
point1.set_data([], [])
point2.set_data([], [])
radius_line1.set_data([], [])
radius_line2.set_data([], [])
velocity_line1.set_data([], [])
velocity_line2.set_data([], [])
velocity_text1.set_text("")
velocity_text2.set_text("")
return (point1, point2, radius_line1, radius_line2, velocity_line1, velocity_line2, velocity_text1, velocity_text2)
def animate(frame):
t = frame / fps
theta = omega * t
# Wheel 1 (small, at (0,0))
x1 = R1 * np.cos(theta)
y1 = R1 * np.sin(theta)
point1.set_data([x1], [y1])
radius_line1.set_data([0, x1], [0, y1])
# Velocity (tangent) vector
vx1 = -omega * R1 * np.sin(theta)
vy1 = omega * R1 * np.cos(theta)
vnorm1 = np.hypot(vx1, vy1)
velocity_line1.set_data([x1, x1 + vx1 * 0.5], [y1, y1 + vy1 * 0.5])
velocity_text1.set_text(f"Small: v=({vx1:.2f}, {vy1:.2f}), |v|={vnorm1:.2f}")
# Wheel 2 (large, center at (R2*1.7, 0))
cx2, cy2 = R2 * 1.7, 0
x2 = cx2 + R2 * np.cos(theta)
y2 = cy2 + R2 * np.sin(theta)
point2.set_data([x2], [y2])
radius_line2.set_data([cx2, x2], [cy2, y2])
vx2 = -omega * R2 * np.sin(theta)
vy2 = omega * R2 * np.cos(theta)
vnorm2 = np.hypot(vx2, vy2)
velocity_line2.set_data([x2, x2 + vx2 * 0.5], [y2, y2 + vy2 * 0.5])
velocity_text2.set_text(f"Large: v=({vx2:.2f}, {vy2:.2f}), |v|={vnorm2:.2f}")
return (point1, point2, radius_line1, radius_line2, velocity_line1, velocity_line2, velocity_text1, velocity_text2)
anim = FuncAnimation(fig, animate, init_func=init, frames=int(T * fps), interval=interval, blit=True)
anim # Show animation in Jupyter